【红宝地产】渥太华房价|2023.10月房市数据|平衡偏买家,抓住房价低谷潮


渥太华十月份房屋销售呈现典型的冷淡态势
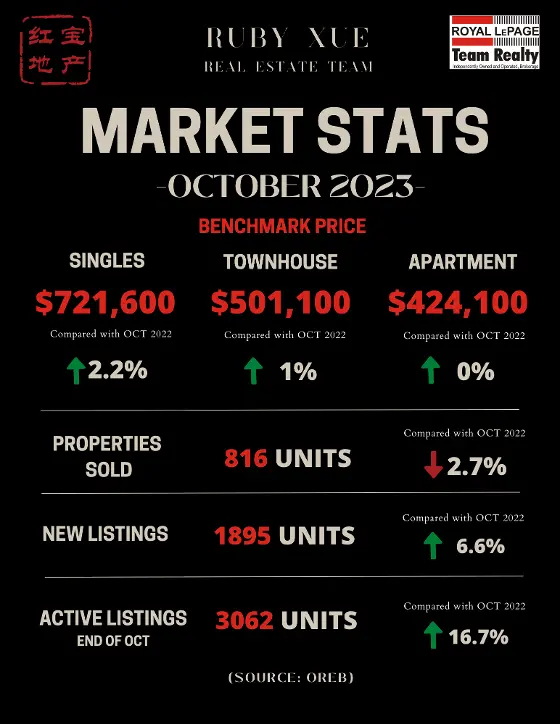
2023年10月,通过渥太华房地产局系统售出的房屋数量为816套。与2022年10月相比,略微减少了2.7%。
10月份的房屋销量比5年平均水平低36.4%,比10年平均水平低30.8%。
今年前 10 个月的房屋销售量为 10,700 套,同比大幅下降 12.4%。与 2022 年同期相比,大幅下降了 12.3%。
"OREB总裁肯-德克尔(Ken Dekker)说:"如今生活成本高昂,这很可能导致买家和卖家都按兵不动。"我们看到销售活动正在缓慢下降,但降幅很小,在每年的这个时候并不出人意料。价格正在调整和下降,这也表明了正在销售的房屋类型--公寓的销售活动比去年 10 月增长最多。虽然渥太华的库存量在缓慢增加,但长期的供应问题意味着需求始终存在。不要被眼前的冷清所迷惑:现在是买家寻找机会的最佳时机,以免被大流从平衡市场带入卖家领地。

价格:MLS® 房价指数 (HPI) 比平均价格或中位价格更准确地追踪价格趋势。
2023 年 10 月,MLS® HPI 综合基准价格为 63.86 万加币,几乎没有变化,与 2022 年 10 月相比仅上涨了 1.8%。
独户住宅的基准价格为72.16万加币,9月份同比上涨2.2%。
相比之下,联排别墅的基准价格为 50.11 万加币,几乎没有变化,与去年同期相比上涨了 1%。
公寓的基准价格为 42.41 万加币,与去年同期水平持平。
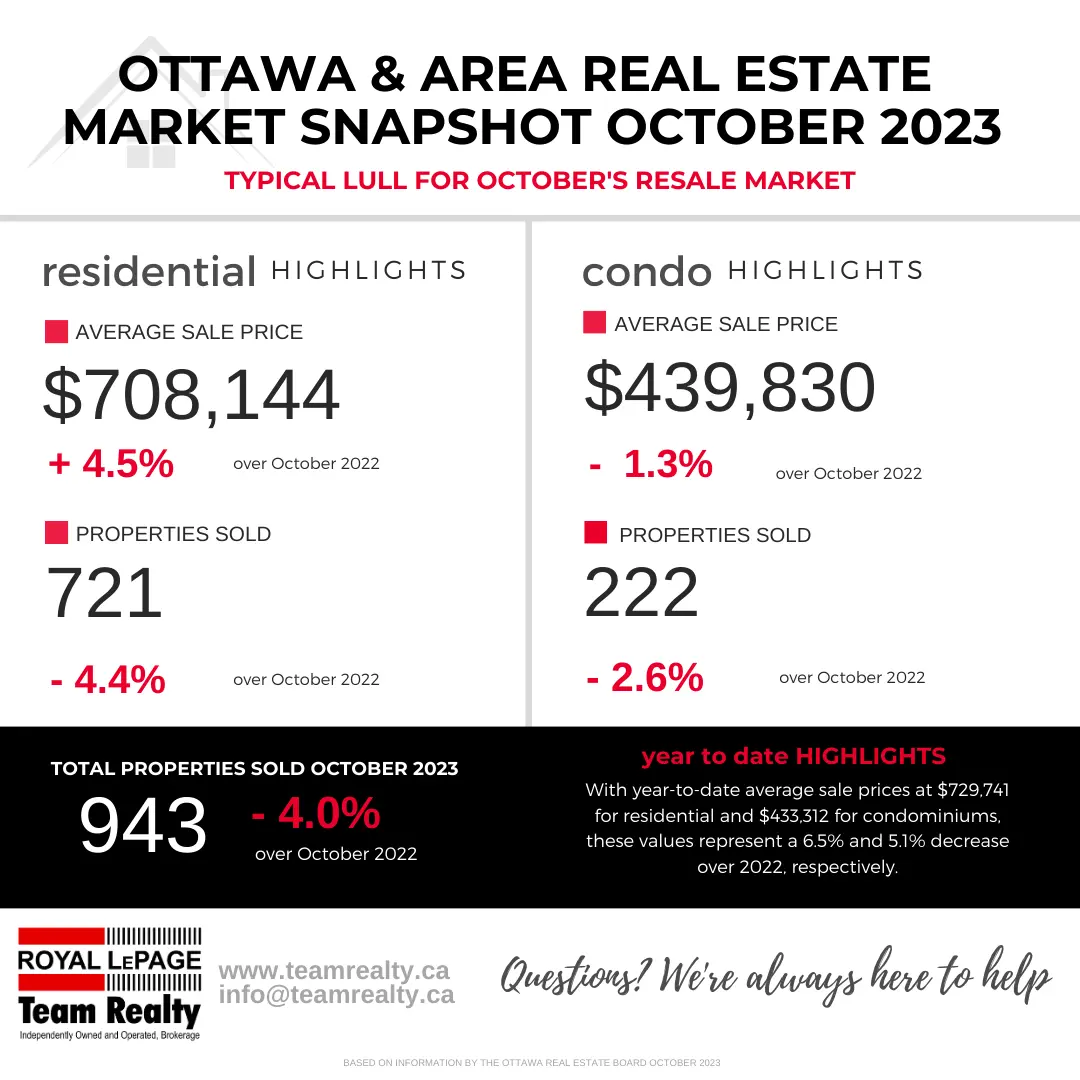
2023 年 10 月售出的住宅均价为 660,836 加币,比 2022 年 10 月上涨了 2.9%。今年迄今为止的综合平均价格为 671,983 加币,与 2022 年前十个月相比下降了 5.9%。
2023 年 10 月的所有房屋销售金额为 5.392 亿加币,与 2022 年同期持平。
OREB 提醒说,平均销售价格有助于确定一段时间内的趋势,但不应被用作特定房产升值或贬值的指标。平均售价是根据所有售出房产的总金额计算得出的。不同社区的价格会有所不同。
库存和新挂牌房源:
新挂牌房源数量比 2022 年 10 月增加了 6.6%。2023 年 10 月共有 1,895套新住宅挂牌。10月份的新挂牌量比五年平均水平高出 2%,比十年平均水平高出 5.4%。
截至 10 月底,市场上的活跃住宅挂牌量为 3,062套,与 2022 年 10 月底相比大幅增长了 16.7%。五年多来,10 月份的活跃挂牌量从未如此之高。
10月份的活跃房源比 5 年平均水平高出 43.8%,比10年平均水平低 10.9%。
2023年10月底的库存月数为3.8个月,略高于2022年10月底的3.1个月。库存月数是指以目前的销售活动速度出售当前库存所需的月数。
(来源:渥太华地产局)

The number of homes sold through the MLS® System of the Ottawa Real Estate Board totaled 816 units in October 2023. This was a small reduction of 2.7% from October 2022.
Home sales were 36.4% below the five-year average and 30.8% below the 10-year average for the month of October.
On a year-to-date basis, home sales totaled 10,700 units over the first 10 months of the year. This was a substantial decline of 12.3% from the same period in 2022.
“Life is expensive these days, which likely has both buyers and sellers staying put,” says Ken Dekker, OREB President. “We’re seeing a slow decline in sales activity but it’s minimal and not unexpected for this time of year. Prices are adjusting and coming down, which is also indicative of the types of homes that are selling — apartments seeing the largest increase in sales activity over last October. While Ottawa’s inventory is slowly building, chronic supply issues mean there’s always an undercurrent of demand. Don’t let the lull fool you: now is a prime time for buyers to be looking for opportunities before the current carries us from a balanced market into seller’s territory.”
By the Numbers – Prices:
The MLS® Home Price Index (HPI) tracks price trends far more accurately than is possible using average or median price measures.
The overall MLS® HPI composite benchmark price was $638,600 in October 2023, nearly unchanged, up only 1.8% from October 2022.
The benchmark price for single-family homes was $721,600, up 2.2% on a year-over-year basis in September.
By comparison, the benchmark price for a townhouse was $501,100, nearly unchanged, up 1% compared to a year earlier.
The benchmark apartment price was $424,100, unchanged from year-ago levels.
The average price of homes sold in October 2023 was $660,836, increasing 2.9% from October 2022. The more comprehensive year-to-date average price was $671,983, a decline of 5.9% from the first ten months of 2022.
The dollar value of all home sales in October 2023 was $539.2 million, unchanged from the same month in 2022.
OREB cautions that the average sale price can be useful in establishing trends over time but should not be used as an indicator that specific properties have increased or decreased in value. The calculation of the average sale price is based on the total dollar volume of all properties sold. Price will vary from neighbourhood to neighbourhood.
By the Numbers – Inventory & New Listings:
The number of new listings saw an increase of 6.6% from October 2022. There were 1,895 new residential listings in October 2023. New listings were 2% above the five-year average and 5.4% above the 10-year average for the month of October.
Active residential listings numbered 3,062 units on the market at the end of October, a sizable gain of 16.7% from the end of October 2022. Active listings haven’t been this high in the month of October in more than five years.
Active listings were 43.8% above the five-year average and 10.9% below the 10-year average for the month of October.
Months of inventory numbered 3.8 at the end of October 2023, just up from the 3.1 months recorded at the end of October 2022. The number of months of inventory is the number of months it would take to sell current inventories at the current rate of sales activity.
(SOURCE: OREB)