2024年底,加拿大渥太华的地产经纪们都经历了什么?


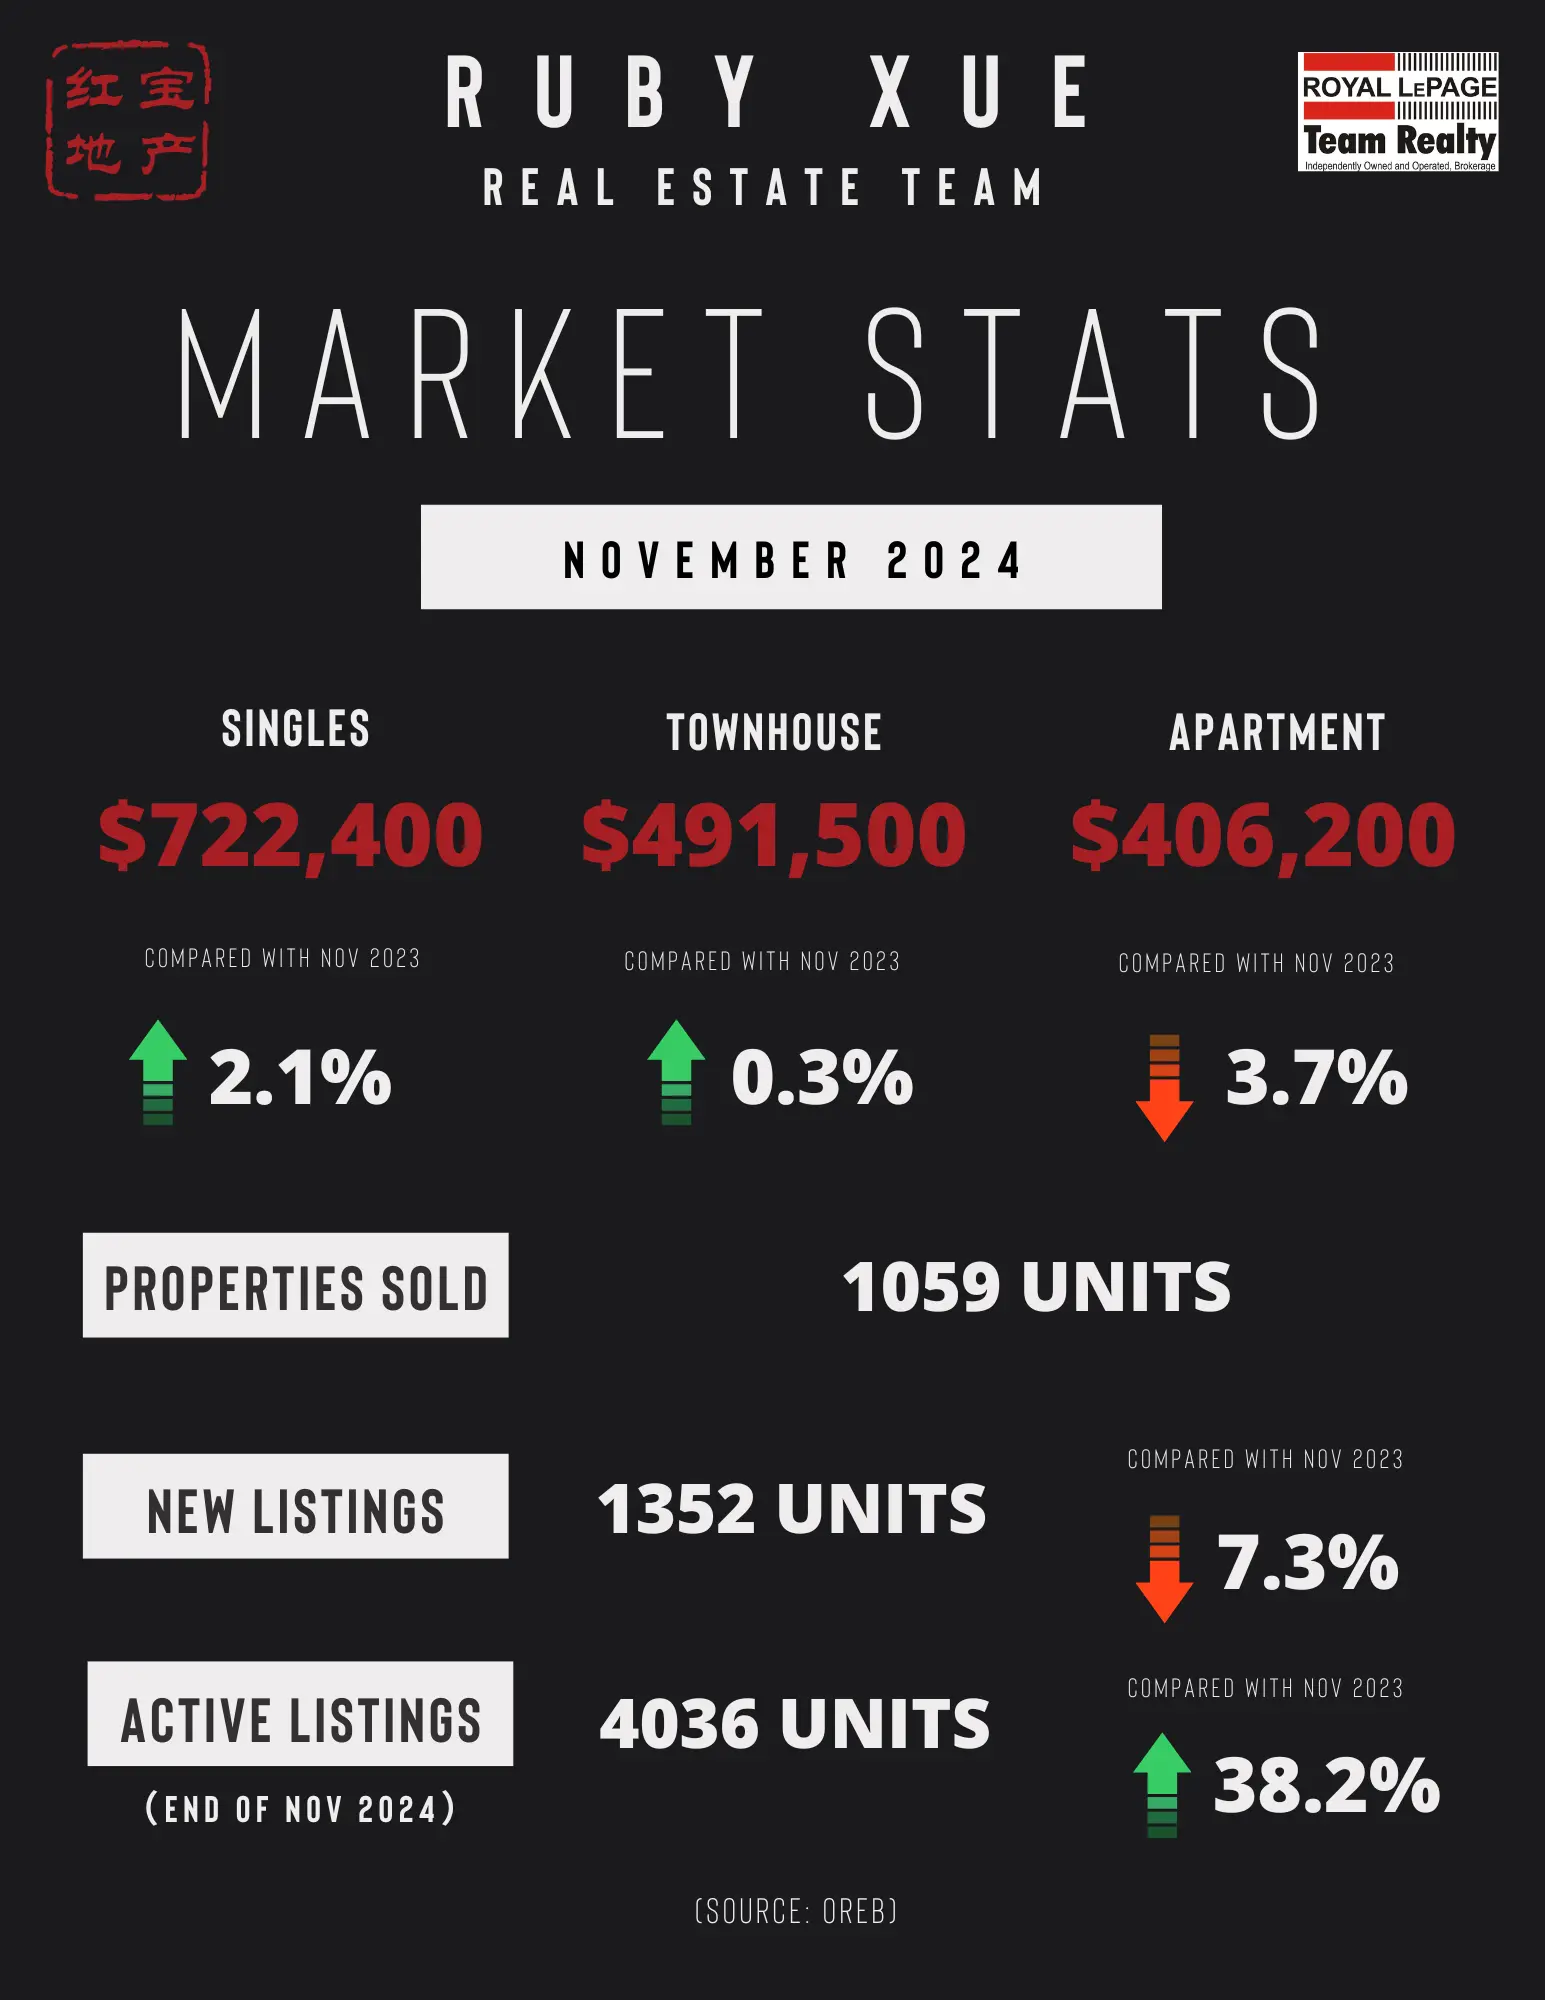
The number of homes sold through the MLS® System of the Ottawa Real Estate Board (OREB) totaled 1,059 units in November 2024 — a slight dip down from the 1,179 units sold the month previous.
Home sales were 3.1% below the five-year average and 0.5% below the 10-year average for the month of November.
On a year-to-date basis, home sales totaled 12,882 units in November 2024 — an increase of 11.8% from the same period in 2023.
“Ottawa’s market is making headway on a long road back from the slowdown experienced in 2023,” says OREB Past-President Curtis Fillier. “Buyers have been slow to come back to the market while watching the interest rates lower, and some are waiting to see how new mortgage rules — the extended amortization period and the increased default insurance cap — coming into effect in December may redefine their purchasing power. Sellers have noticed that caution and those who can are likely holding on for a more active spring.”
“There will be the typical slowdown at this time of the year as people’s attentions turn to the holidays, and the snow starts to cover a property’s selling features,” says Fillier. “With prices holding steady and open houses getting traffic, though, people are keeping a close eye on opportunities.”
By the Numbers – Prices:
The MLS® Home Price Index (HPI) tracks price trends far more accurately than is possible using average or median price measures.
The overall MLS® HPI composite benchmark price was $636,700 in November 2024, an increase of 1.5% from November 2023.
The benchmark price for single-family homes was $722,400, up 2.1% on a year-over-year basis in November.
By comparison, the benchmark price for a townhouse/row unit was $491,500, up 0.3% compared to a year earlier.
The benchmark apartment price was $406,200, down 3.7% from last year.
The average price of homes sold in November 2024 was $667,098 increasing 4.6% from November 2023.
The more comprehensive year-to-date average price was $679,797, increasing by 1.2% from November 2023.
The dollar volume of all home sales in November 2024 was $706.4 million, up 51.8% from November 2023.
OREB cautions that the average sale price can be useful in establishing trends over time but should not be used as an indicator that specific properties have increased or decreased in value. The calculation of the average sale price is based on the total dollar volume of all properties sold. Prices will vary from neighbourhood to neighbourhood.
By the Numbers – Inventory & New Listings
The number of new listings saw a decrease of 7.3% from November 2023. There were 1,352 new residential listings in November 2024. New listings were 6.3% below the five-year average and 0.3% above the 10-year average for the month of November.
Active residential listings numbered 4,036 units on the market at the end of November 2024, a gain of 38.2% from November 2023. Active listings were 72.8% above the five-year average and 44.3% above the 10-year average for the month of November.
Months of inventory numbered 3.8 at the end of November 2024, compared to 4.0 in November 2023. The number of months of inventory is the number of months it would take to sell current inventories at the current rate of sales activity.
(SOURCE: OREB)

根据渥太华房地产委员会(OREB)的MLS®系统数据,2024年11月通过MLS®系统售出的房屋总数为1,059套,相较于前一个月售出的1,179套略有下降。
11月的房屋销售量比五年平均水平低3.1%,比十年平均水平低0.5%。
截至2024年11月,全年累计房屋销售量达到12,882套,比2023年同期增长11.8%。
“渥太华的市场正在从2023年的放缓中逐步复苏,”OREB前任主席Curtis Fillier表示。“随着买家观察利率逐步下降,部分人还在等待即将于12月生效的新按揭规则(延长的摊还期和提高的违约保险额度)对其购买力的影响。一些卖家注意到了这种观望情绪,若条件允许,他们可能会选择等待春季更活跃的市场。”
“年末通常会出现季节性市场放缓,因为人们的注意力转向节日,而积雪也掩盖了房产的部分卖点,”Fillier补充道。“不过,由于价格保持稳定且开放看房的人流量持续,市场机会仍然受到密切关注。”
MLS®房价指数(HPI)比平均或中位数房价更准确地追踪价格趋势。
2024年11月,整体MLS® HPI综合基准价格为636,700加元,同比上涨1.5%。
单户住宅基准价格为722,400加元,同比增长2.1%。
联排/排屋基准价格为491,500加元,同比上涨0.3%。
公寓基准价格为406,200加元,同比下降3.7%。
2024年11月售出的房屋平均价格为667,098加元,同比上涨4.6%。
更全面的年初至今平均价格为679,797加元,同比上涨1.2%。
2024年11月的总销售额为7.064亿加元,比2023年11月增长51.8%。
OREB提醒,平均售价可以用来观察长期趋势,但不应作为具体房产增值或贬值的直接指标。平均售价的计算基于所有售出房产的总销售额,而价格会因不同社区而异。
新增房源数量较2023年11月减少7.3%,2024年11月新增住宅房源为1,352套。新增房源比五年平均水平低6.3%,但比十年平均水平高0.3%。
截至2024年11月底,活跃住宅房源数量为4,036套,比2023年11月增长38.2%。活跃房源比五年平均水平高72.8%,比十年平均水平高44.3%。
2024年11月底的库存月数为3.8个月,而2023年11月为4.0个月。库存月数表示以当前销售速度售完现有库存所需的时间。
(数据来源:渥太华地产局OREB)