Ottawa Real Estate Market Update

In the fast-paced Ottawa real estate market, knowledge isn't just power—it's your strategic advantage. Understanding the latest trends in sales, pricing, and inventory is the first step toward making an empowered decision, whether you're planning to buy, sell, or invest. Here is our expert breakdown of the key data you need to know for.

RSS

OTTAWA REAL ESTATE - MARCH STATS (2025)

Ottawa Housing Market Shows Stability as Spring Momentum Builds

The number of homes sold through the MLS® System of the Ottawa Real Estate Board (OREB) totaled 1,103 units in March 2025. This represented a 6.2% decline from March 2024. 

Home sales were 24% below the five-year average and 19.3% below the 10-year average for the month of March.

“The Ottawa housing market in March 2025 remained relatively stable, with sales activity slightly lower than the same period last year,” said OREB President Paul Czan. “However, we’re seeing continued momentum month-over-month as the spring market gains traction. Both buyers and sellers are exercising some caution—likely due to economic uncertainty and the upcoming election—but the current lower interest rates are encouraging more activity as they step off the sidelines.”

“Looking ahead, the ongoing trade and tariff concerns could affect new construction and further exacerbate supply challenges,” Czan adds. “So, it’s critical that the City of Ottawa continues collaborating with key stakeholders. We were pleased to take part in discussions around the proposed New Zoning By-Law, which prioritizes housing options and opportunities to maximize options for Ottawa’s residents.”

By the Numbers – Prices:

  • The overall MLS® HPI composite benchmark price was $626,200 in March 2025, a 2.2% rise compared to March 2024.

    • The benchmark price for single-family homes was $698,700, up 2.7% year-over-year in March.

    • By comparison, the benchmark price for a townhouse/row unit was $431,200, a decline of 8.0% from 2024.

    • The benchmark apartment price was $400,900, a 4.3% decline from the previous year.

  • The average price of homes sold in March 2025 was $685,866, unchanged from March 2024.

  • The total dollar volume of all home sales in March 2025 amounted to $756.5 million, a 6.2% drop compared to the same period last year.

By the Numbers – Inventory & New Listings:

  • The number of new listings rose by 4.1% compared to March 2024, with 2,221 new residential properties added to the market. New listings were 0.7% below the five-year average and 2.2% below the 10-year average for the month of March.

  • Active residential listings totaled 4,319 units at the end of March 2025, reflecting a substantial 60.3% surge from March 2024. Active listings were 92.7% above the five-year average and 49.5% above the 10-year average for the month of March.

  • Months of inventory stood at 3.9 at the end of March 2025, compared to 2.3 in March 2024. The number of months of inventory is the number of months it would take to sell current inventories at the current rate of sales activity.

(SOURCE: OREB)

Read

OTTAWA REAL ESTATE - FEBRUARY STATS (2025)

Ottawa Real Estate Market Holds Steady Amid Changing Conditions

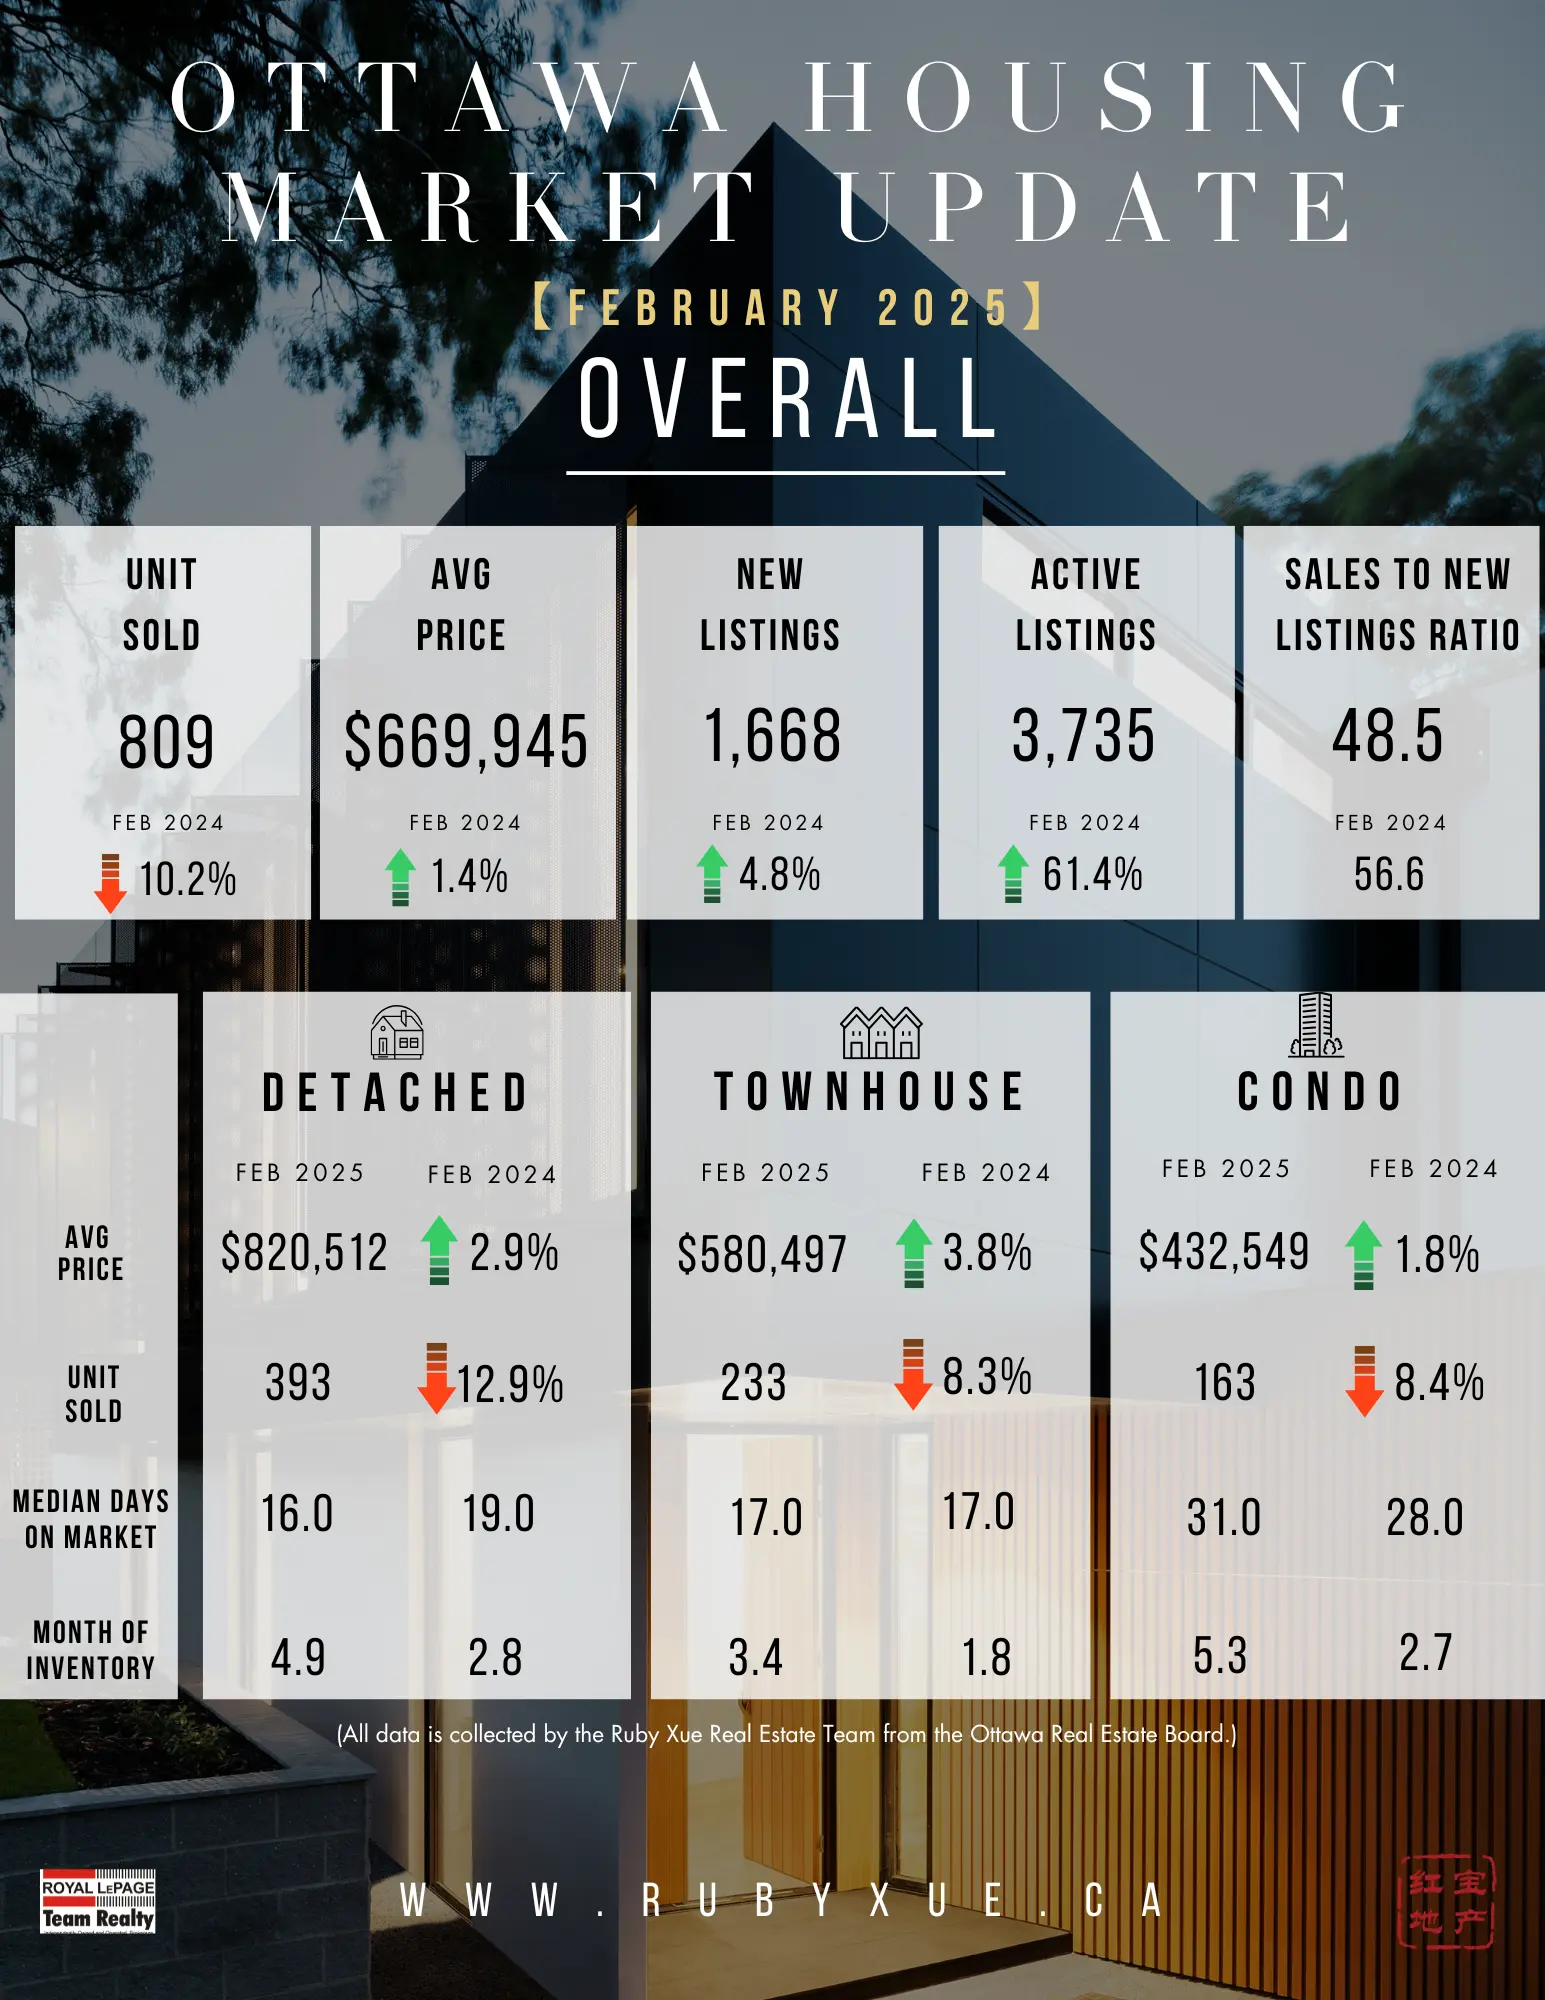
The number of homes sold through the MLS® System of the Ottawa Real Estate Board (OREB) totaled 809 units in February 2025. This represented a 10.2% decline from February 2024.

Home sales were 19.1% below the five-year average and 15.4% below the 10-year average for the month of February.

“Ottawa’s sales activity moderated while prices held steady,” says OREB President Paul Czan. “Despite increased inventory, market uncertainty continues to influence buyer and seller decisions. Some sellers who had previously delayed listing are now entering the market, contributing to more options for buyers. While demand remains strong in certain price segments, the pace of sales varies, making strategic pricing and preparation key for sellers.”

“The Bank of Canada’s influence on borrowing power, ongoing economic factors like tariffs, and the potential impact of upcoming elections are also shaping buyer and seller sentiment,” adds Czan. “As we approach the spring market, we anticipate increased buyer activity, particularly if interest rates trend downward and confidence continues to build.”

By the Numbers – Prices:

The MLS® Home Price Index (HPI) tracks price trends far more accurately than is possible using average or median price measures.

  • The overall MLS® HPI composite benchmark price was $658,300 in February 2025, a 4.4% rise compared to February 2024.

    • The benchmark price for single-family homes was $719,800, up 1.3% year-over-year uptick in February.

    • By comparison, the benchmark price for a townhouse/row unit was $438,000, a decline of 11.6% from 2024.  

    • The benchmark apartment price was $459,300, a 4.5% gain from the previous year. 

  • The average price of homes sold in February 2025 was $669,945, a 1.4% improvement from February 2024. 

  • The total dollar volume of all home sales in February 2025 amounted to $541.9 million, an 8.9% drop compared to the same period last year.

OREB cautions that the average sale price can be useful in establishing trends over time but should not be used as an indicator that specific properties have increased or decreased in value. The calculation of the average sale price is based on the total dollar volume of all properties sold. Prices will vary from neighbourhood to neighbourhood.

By the Numbers – Inventory & New Listings:

  • The number of new listings rose by 4.8% compared to February 2024, with 1,668 new residential properties added to the market. New listings were 10.8% above the five-year average and 6.7% above the 10-year average for the month of February.

  • Active residential listings totaled 3,735 units at the end of February 2025, reflecting a substantial 61.4% surge from February 2024. Active listings were 95.7% above the five-year average and 51.4% above the 10-year average for the month of February.

  • Months of inventory stood at 4.6 at the end of February 2025, compared to 2.6 in February 2024. The number of months of inventory is the number of months it would take to sell current inventories at the current rate of sales activity.

(SOURCE: OREB)
Read

OTTAWA REAL ESTATE - JANUARY STATS (2025)

Ottawa’s Market Warms Up with More Listings and Cautious Buyers

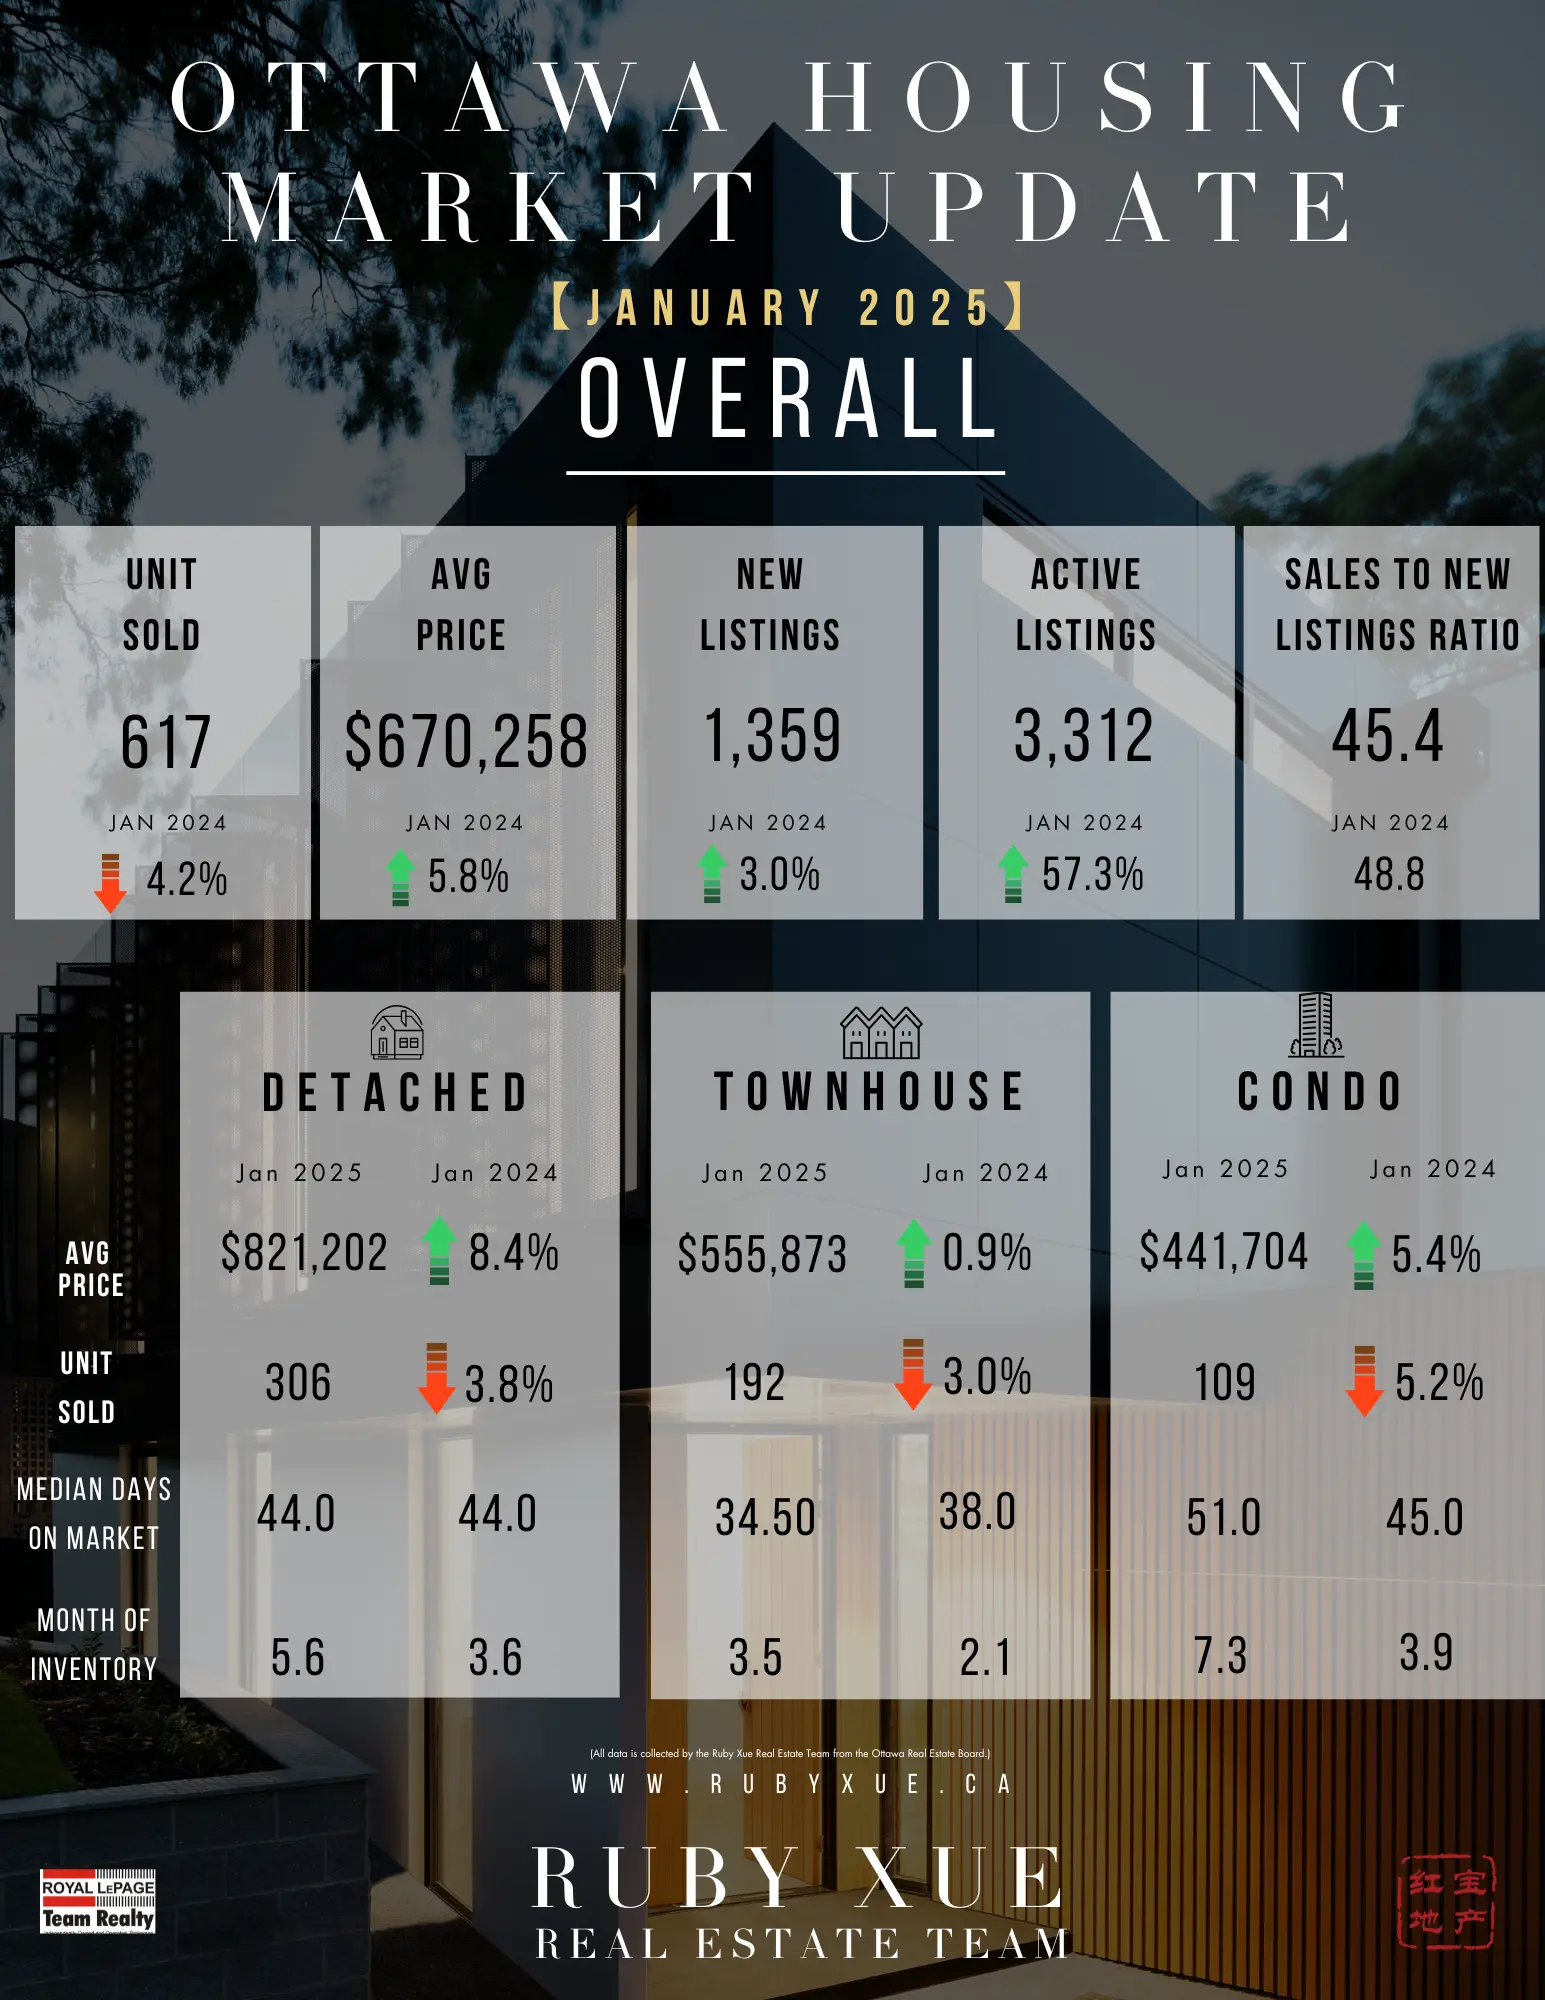
The number of homes sold through the MLS® System of the Ottawa Real Estate Board (OREB) totaled 617 units in January 2025. This was a 4.2% decrease from January 2024.    

Home sales were 13% below the five-year average and 9.6% below the 10-year average for the month of January. 

“Ottawa’s market is seeing increased activity as more listings hit the market and buyers start to re-engage,” says OREB President Paul Czan. “Many buyers and sellers had been waiting for more conducive market conditions, but with the recent rate cut and potentially lower interest rates on the horizon, optimism is growing. While there’s more supply, the availability of suitable properties in various market segments remains tight. This is reflected in some homes selling quickly while others linger on the market. Sellers should be prepared to price competitively and present their homes in the best light to capture buyer interest in this evolving market.”

“The recent Bank of Canada rate cut, introduction of U.S. tariffs, along with upcoming provincial and federal elections, introduce factors of variability,” adds Czan. “That said, confidence is growing, and more buyers are expected to return to the market in the coming months, leading to an increase in transactions.”

By the Numbers – Prices: 

The MLS® Home Price Index (HPI) tracks price trends far more accurately than is possible using average or median price measures. 

  • The overall MLS® HPI composite benchmark price was $649,900 in January 2025, an increase of 5.2% from January 2024.  

    • The benchmark price for single-family homes was $713,000 up 2.3% on a year-over-year basis in January.  

    • By comparison, the benchmark price for a townhouse/row unit was $448,000, down 3.9% compared to a year earlier.  

    • The benchmark apartment price was $436,900, up 4.5% from last year. 

  • The average price of homes sold in January 2025 was $670,258, increasing 5.8% from January 2024.  

  • The dollar volume of all home sales in January 2025 was $413.5 million, up 1.3% from January 2024.  

OREB cautions that the average sale price can be useful in establishing trends over time but should not be used as an indicator that specific properties have increased or decreased in value. The calculation of the average sale price is based on the total dollar volume of all properties sold. Prices will vary from neighbourhood to neighbourhood.  

By the Numbers – Inventory & New Listings 

  • The number of new listings saw an increase of 3.0% from January 2024. There were 1,359 new residential listings in January 2025. New listings were 14.1% above the five-year average and 9.3% above the 10-year average for the month of January. 

  • Active residential listings numbered 3,312 units on the market at the end of January 2025, a gain of 57.3% from January 2024. Active listings were 90.6% above the five-year average and 48.9% above the 10-year average for the month of January. 

  • Months of inventory numbered 5.4 at the end of January 2025, compared to 3.3 in January 2024. The number of months of inventory is the number of months it would take to sell current inventories at the current rate of sales activity. 

(SOURCE: OREB)

Read

OTTAWA REAL ESTATE - DECEMBER STATS (2024)

Ottawa’s MLS® December Market Closes Year with Optimism

The number of homes sold through the MLS® System of the Ottawa Real Estate Board (OREB) totaled 613 units in December 2024. This was a 7.9% increase from December 2023.  

Home sales were 6.8% below the five-year average and 2.7% below the 10-year average for the month of December.

On a year-to-date basis, home sales totaled 13,526 units in December 2024 — an increase of 11.8% from the same period in 2023.

“A year of wait-and-see came to a close with the expected slowdown over the holiday season,” says OREB President Paul Czan. “The latter half of the year brought signs of more favourable market conditions with consecutive interest rate drops, higher insured mortgage limits and extended amortizations. It’s early to assess the impact of these measures. And it’s an uphill battle against affordability and supply issues that persist.”

“Listing activity indicates that sellers anticipate improved conditions could spur more activity from buyers who have been keeping a close eye on the market but hesitant to make moves. Buyers are still limited in their selection of affordable inventory that can meet current demands, which stalls movement. While the improving market conditions are encouraging, the supply needs to be there. Coming political shifts are adding a layer of uncertainty but there is a trending optimism for more increased market activity in the months ahead.”

By the Numbers – Prices: 

The MLS® Home Price Index (HPI) tracks price trends far more accurately than is possible using average or median price measures. 

  • The overall MLS® HPI composite benchmark price was $645,800 in December 2024, an increase of 3.8% from December 2023.

    • The benchmark price for single-family homes was $729,300, up 3.7% on a year-over-year basis in December.

    • By comparison, the benchmark price for a townhouse/row unit was $533,200, up 11.3% compared to a year earlier.

    • The benchmark apartment price was $404,400, down 2.5% from last year.

  • The average price of homes sold in December 2024 was $663,781, increasing 4.4% from December 2023. The more comprehensive year-to-date average price was $679,067, increasing by 1.3% from last year.

  • The dollar volume of all home sales in December 2024 was $406.9 million, up 12.7% from December 2023. The total dollar volume of all home sales in 2024 was $9.2 billion, up 13.3% from all of 2023.

OREB cautions that the average sale price can be useful in establishing trends over time but should not be used as an indicator that specific properties have increased or decreased in value. The calculation of the average sale price is based on the total dollar volume of all properties sold. Prices will vary from neighbourhood to neighbourhood.  

By the Numbers – Inventory & New Listings 

  • The number of new listings saw an increase of 13.6% from December 2023. There were 603 new residential listings in December 2024. New listings were 3.5% above the five-year average and 2.7% below the 10-year average for the month of December.

  • Active residential listings numbered 3,216 units on the market at the end of December 2024, a gain of 58.7% from December 2023. Active listings were 90% above the five-year average and 51.4% above the 10-year average for the month of December.

  • Months of inventory numbered 5.2 at the end of December 2024, compared to 3.6 in December 2023. The number of months of inventory is the number of months it would take to sell current inventories at the current rate of sales activity.

(SOURCE: OREB)
Read

OTTAWA REAL ESTATE - NOVEMBER STATS (2024)

Ottawa’s MLS® Market Making Headway

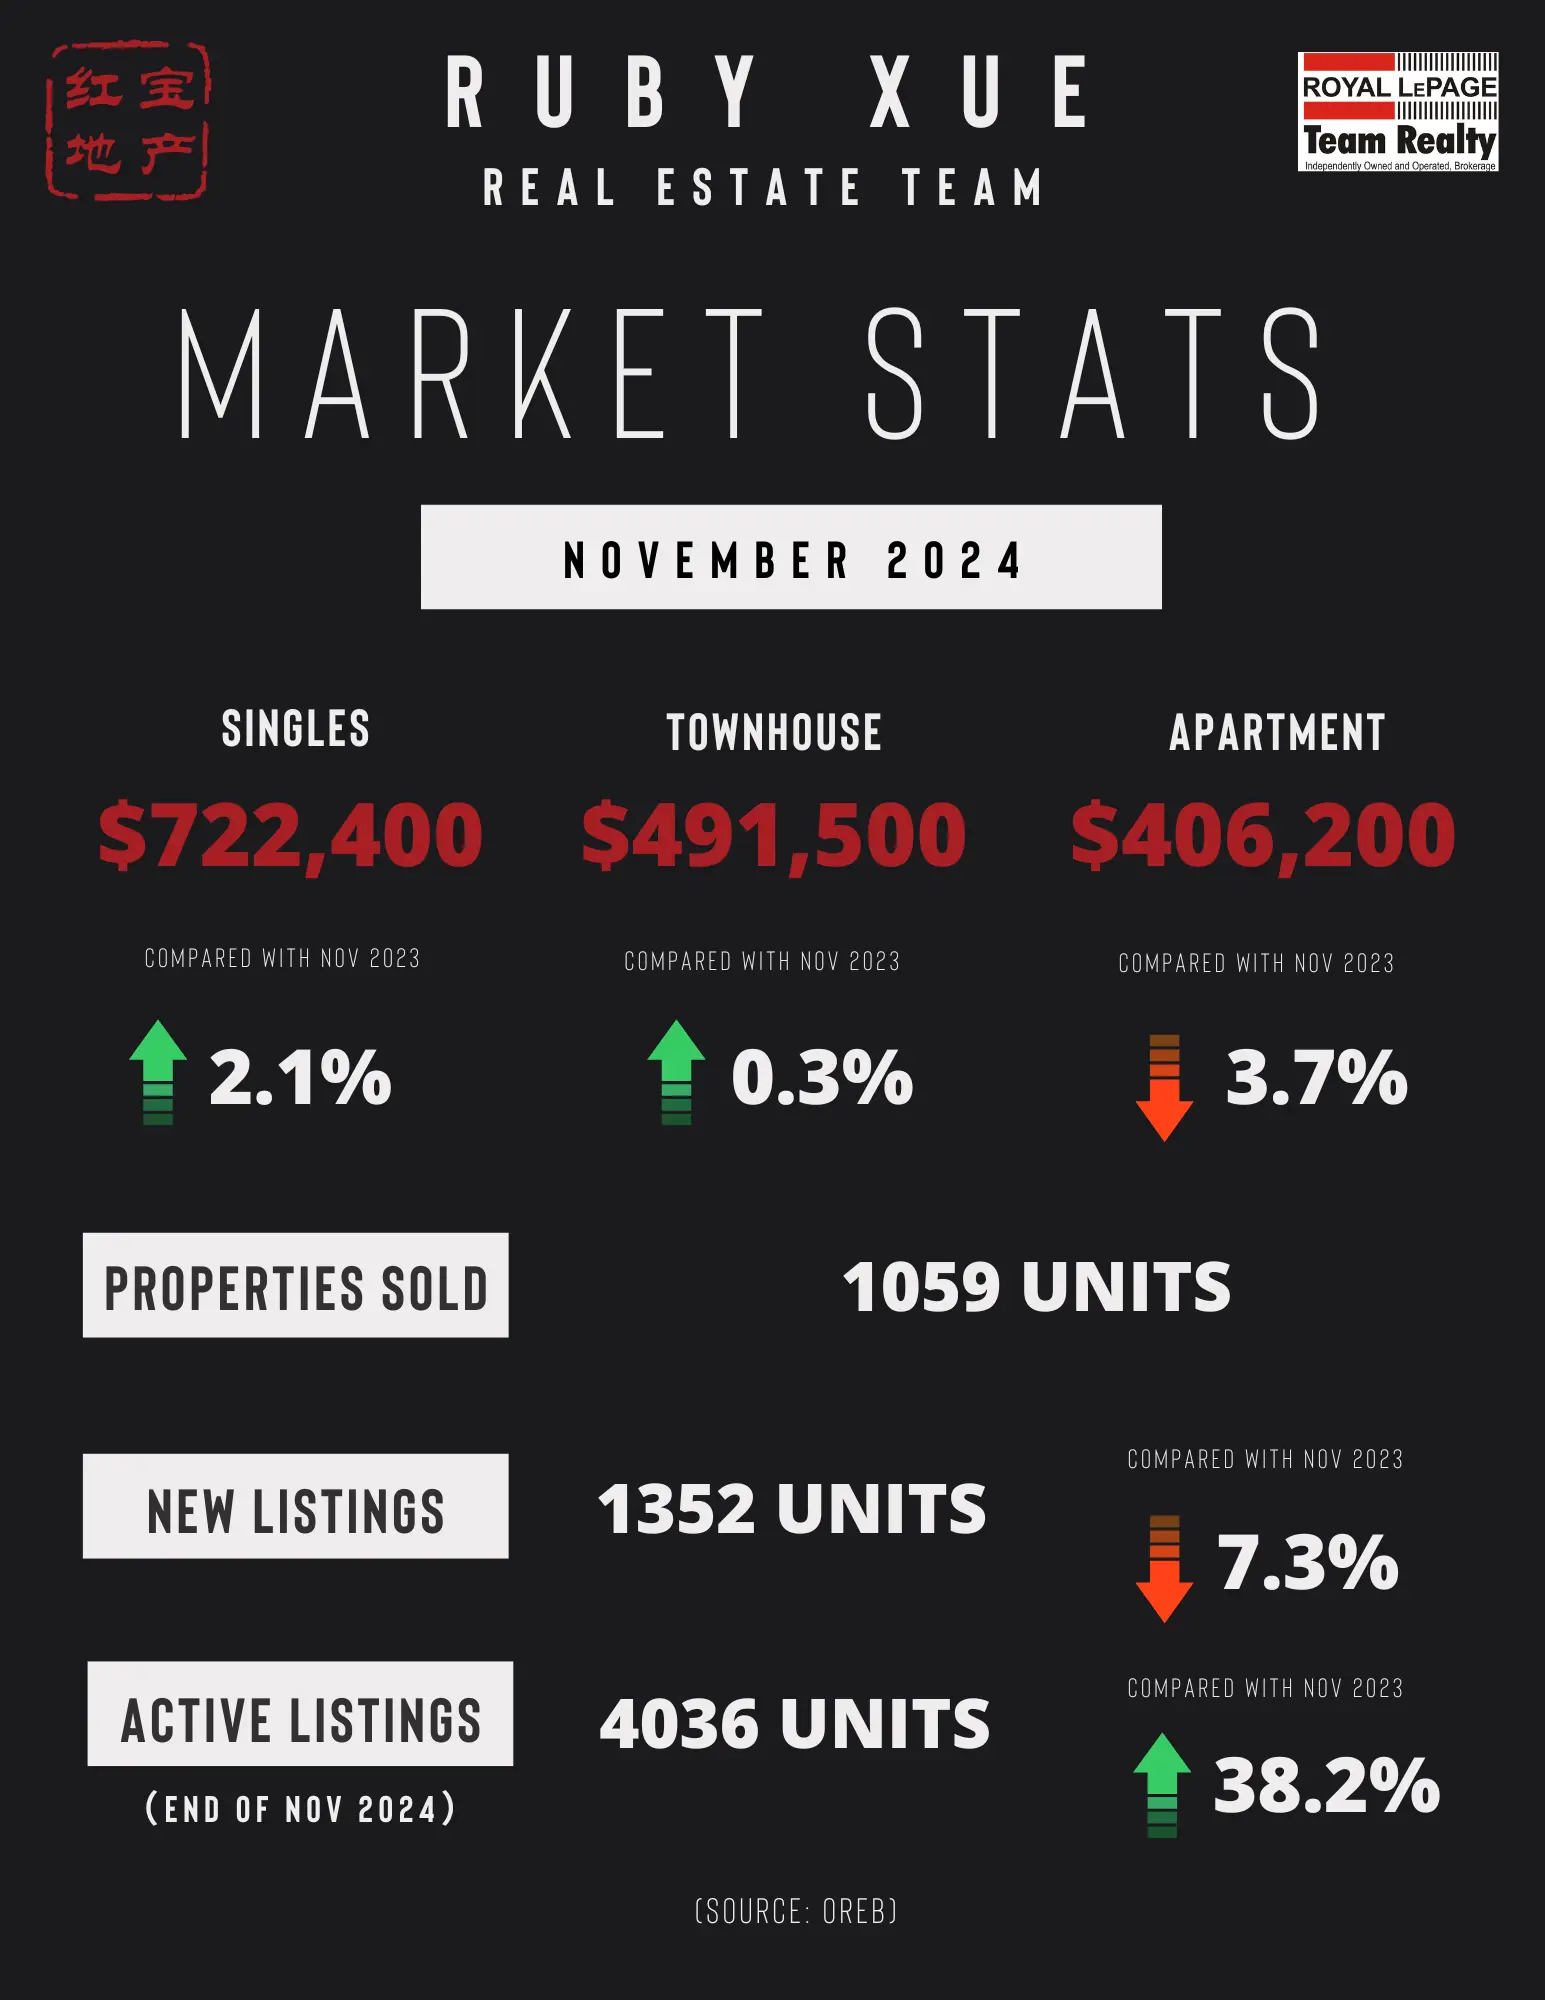
The number of homes sold through the MLS® System of the Ottawa Real Estate Board (OREB) totaled 1,059 units in November 2024 — a slight dip down from the 1,179 units sold the month previous. 

Home sales were 3.1% below the five-year average and 0.5% below the 10-year average for the month of November. 

On a year-to-date basis, home sales totaled 12,882 units in November 2024 — an increase of 11.8% from the same period in 2023.  

“Ottawa’s market is making headway on a long road back from the slowdown experienced in 2023,” says OREB Past-President Curtis Fillier. “Buyers have been slow to come back to the market while watching the interest rates lower, and some are waiting to see how new mortgage rules — the extended amortization period and the increased default insurance cap — coming into effect in December may redefine their purchasing power. Sellers have noticed that caution and those who can are likely holding on for a more active spring.” 

“There will be the typical slowdown at this time of the year as people’s attentions turn to the holidays, and the snow starts to cover a property’s selling features,” says Fillier. “With prices holding steady and open houses getting traffic, though, people are keeping a close eye on opportunities.”  

By the Numbers – Prices: 

  • The MLS® Home Price Index (HPI) tracks price trends far more accurately than is possible using average or median price measures. 

    • The overall MLS® HPI composite benchmark price was $636,700 in November 2024, an increase of 1.5% from November 2023.

      • The benchmark price for single-family homes was $722,400, up 2.1% on a year-over-year basis in November.

      • By comparison, the benchmark price for a townhouse/row unit was $491,500, up 0.3% compared to a year earlier.

      • The benchmark apartment price was $406,200, down 3.7% from last year.

    • The average price of homes sold in November 2024 was $667,098 increasing 4.6% from November 2023.

    • The more comprehensive year-to-date average price was $679,797, increasing by 1.2% from November 2023.

    • The dollar volume of all home sales in November 2024 was $706.4 million, up 51.8% from November 2023.

    OREB cautions that the average sale price can be useful in establishing trends over time but should not be used as an indicator that specific properties have increased or decreased in value. The calculation of the average sale price is based on the total dollar volume of all properties sold. Prices will vary from neighbourhood to neighbourhood.  

    By the Numbers – Inventory & New Listings 

  • The number of new listings saw a decrease of 7.3% from November 2023. There were 1,352 new residential listings in November 2024. New listings were 6.3% below the five-year average and 0.3% above the 10-year average for the month of November.

  • Active residential listings numbered 4,036 units on the market at the end of November 2024, a gain of 38.2% from November 2023. Active listings were 72.8% above the five-year average and 44.3% above the 10-year average for the month of November.

  • Months of inventory numbered 3.8 at the end of November 2024, compared to 4.0 in November 2023. The number of months of inventory is the number of months it would take to sell current inventories at the current rate of sales activity.

    (SOURCE: OREB)

Read

OTTAWA REAL ESTATE - OCTOBER STATS (2024)

Consumer Confidence Cautiously on the Rise in Ottawa Resale Market

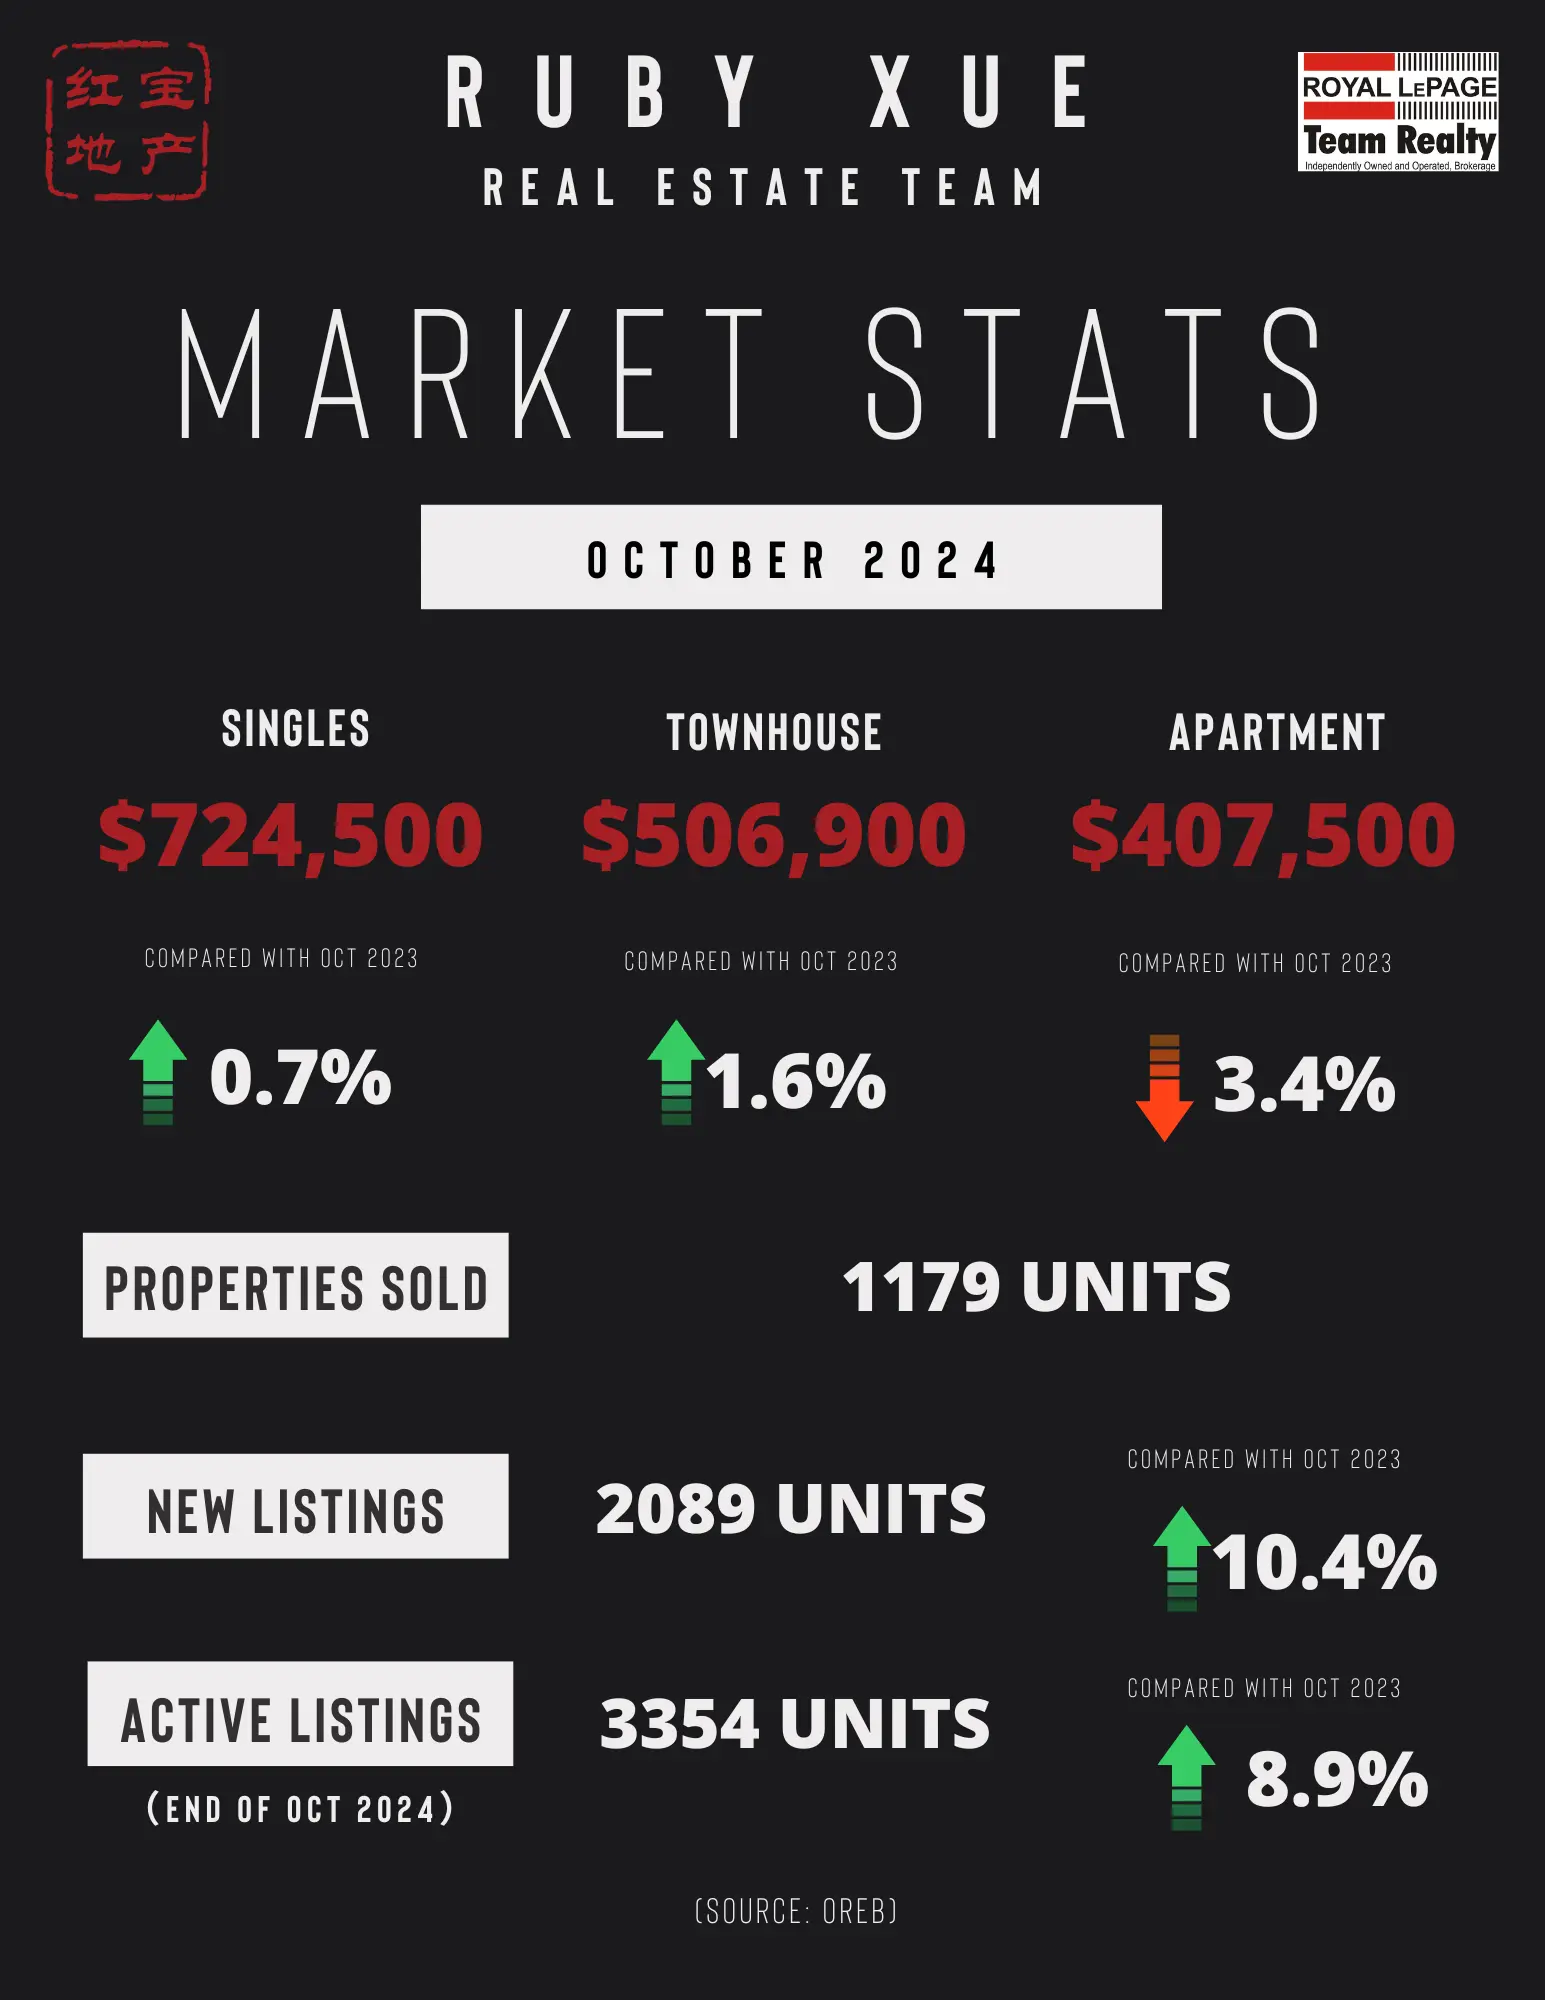
The number of homes sold through the MLS® System of the Ottawa Real Estate Board (OREB) totaled 1,179 units in October 2024 — an increase over the 1,047 units sold last month.

Home sales were 3.9% below the five-year average and 0.9% below the 10-year average for the month of October.

On a year-to-date basis, home sales totaled 11,662 units in October 2024 — an increase of 9.4% from the same period in 2023.

“We’re seeing positive movement in Ottawa’s market with sales activity up,” says OREB President Curtis Fillier. “This is especially interesting because there has been sustained activity throughout the year instead of the typical seasonal spikes and lulls. Consumer confidence is getting stronger, boosted by another consecutive Bank of Canada interest rate cut — though many are waiting for additional rate drops.”

The 50-basis-point reduction might offer optimism following Ontario’s tabling of the Fall Economic Statement where housing starts projections were scaled back to 81,300, representing another reduction in projections and is even further from the province’s goal of creating 125,000 new homes in 2024. The Ontario government cites high interest rates and a tough economic environment as pervasive challenges for homebuilders.

“The challenge remains supply,” says Fillier. “We know from experience that Ottawa’s inventory leans tight and can swing quickly from balanced territory to a seller’s market — which can compound affordability and accessibility challenges. Now is always the time for fresh action and innovative policies that can create much-needed inventory.”

OREB leaders and volunteers recently joined the Canadian Real Estate Association on Parliament Hill to present focused solutions to confront the ongoing housing supply crisis. With expertise and experience in market conditions and consumer needs, REALTORS® advocated to stimulate supply by investing in offsite construction technologies (i.e. prefabricated homes) and extending HST/GST relief for non-profit-built affordable ownership housing.

By the Numbers – Prices: 

The MLS® Home Price Index (HPI) tracks price trends far more accurately than is possible using average or median price measures. 

  • The overall MLS® HPI composite benchmark price was $639,500 in October 2024, an increase of 0.4% from October 2023.

  • The overall MLS® HPI composite benchmark price was $639,500 in October 2024, an increase of 0.4% from October 2023.

    • The benchmark price for single-family homes was $724,500, up 0.7% on a year-over-year basis in October.

    • By comparison, the benchmark price for a townhouse/row unit was $506,900, up 1.6% compared to a year earlier. 

    • The benchmark apartment price was $407,500, down 3.4% from last year.

  • The average price of homes sold in October 2024 was $668,690 increasing 1.2% from October 2023. The more comprehensive year-to-date average price was $678,081, increasing by 0.9% from October 2023.  

  • The dollar volume of all home sales in October 2024 was $788.3 million, up 47.7% from October 2023.

OREB cautions that the average sale price can be useful in establishing trends over time but should not be used as an indicator that specific properties have increased or decreased in value. The calculation of the average sale price is based on the total dollar volume of all properties sold. Prices will vary from neighbourhood to neighbourhood.  

By the Numbers – Inventory & New Listings 

  • The number of new listings saw an increase of 10.4% from October 2023. There were 2,089 new residential listings in October 2024. New listings were 6.7% above the five-year average and 17% above the 10-year average for the month of October.

  • Active residential listings numbered 3,354 units on the market at the end of October 2024, a gain of 8.9% from October 2023. Active listings were 40.6% above the five-year average and 6.7% above the 10-year average for the month of October.

  • Months of inventory numbered 2.8 at the end of October 2024, compared to 3.8 in October 2023. The number of months of inventory is the number of months it would take to sell current inventories at the current rate of sales activity.

    (SOURCE: OREB)

Read

What Do These Numbers Mean for You?

Ottawa's most trusted real estate agent

Whether you're a seller trying to pinpoint the perfect list price or a buyer looking for the right opportunity, we can provide the specific insight you need.

This website may only be used by consumers that have a bona fide interest in the purchase, sale, or lease of real estate of the type being offered via the website. The data relating to real estate on this website comes in part from the MLS® Reciprocity program of the PropTx MLS®. The data is deemed reliable but is not guaranteed to be accurate.