Ottawa Real Estate Market Update

In the fast-paced Ottawa real estate market, knowledge isn't just power—it's your strategic advantage. Understanding the latest trends in sales, pricing, and inventory is the first step toward making an empowered decision, whether you're planning to buy, sell, or invest. Here is our expert breakdown of the key data you need to know for.

RSS

OTTAWA REAL ESTATE - JANUARY STATS (2024)

Ottawa’s MLS® Market Thawed in January but Sales Still Slow

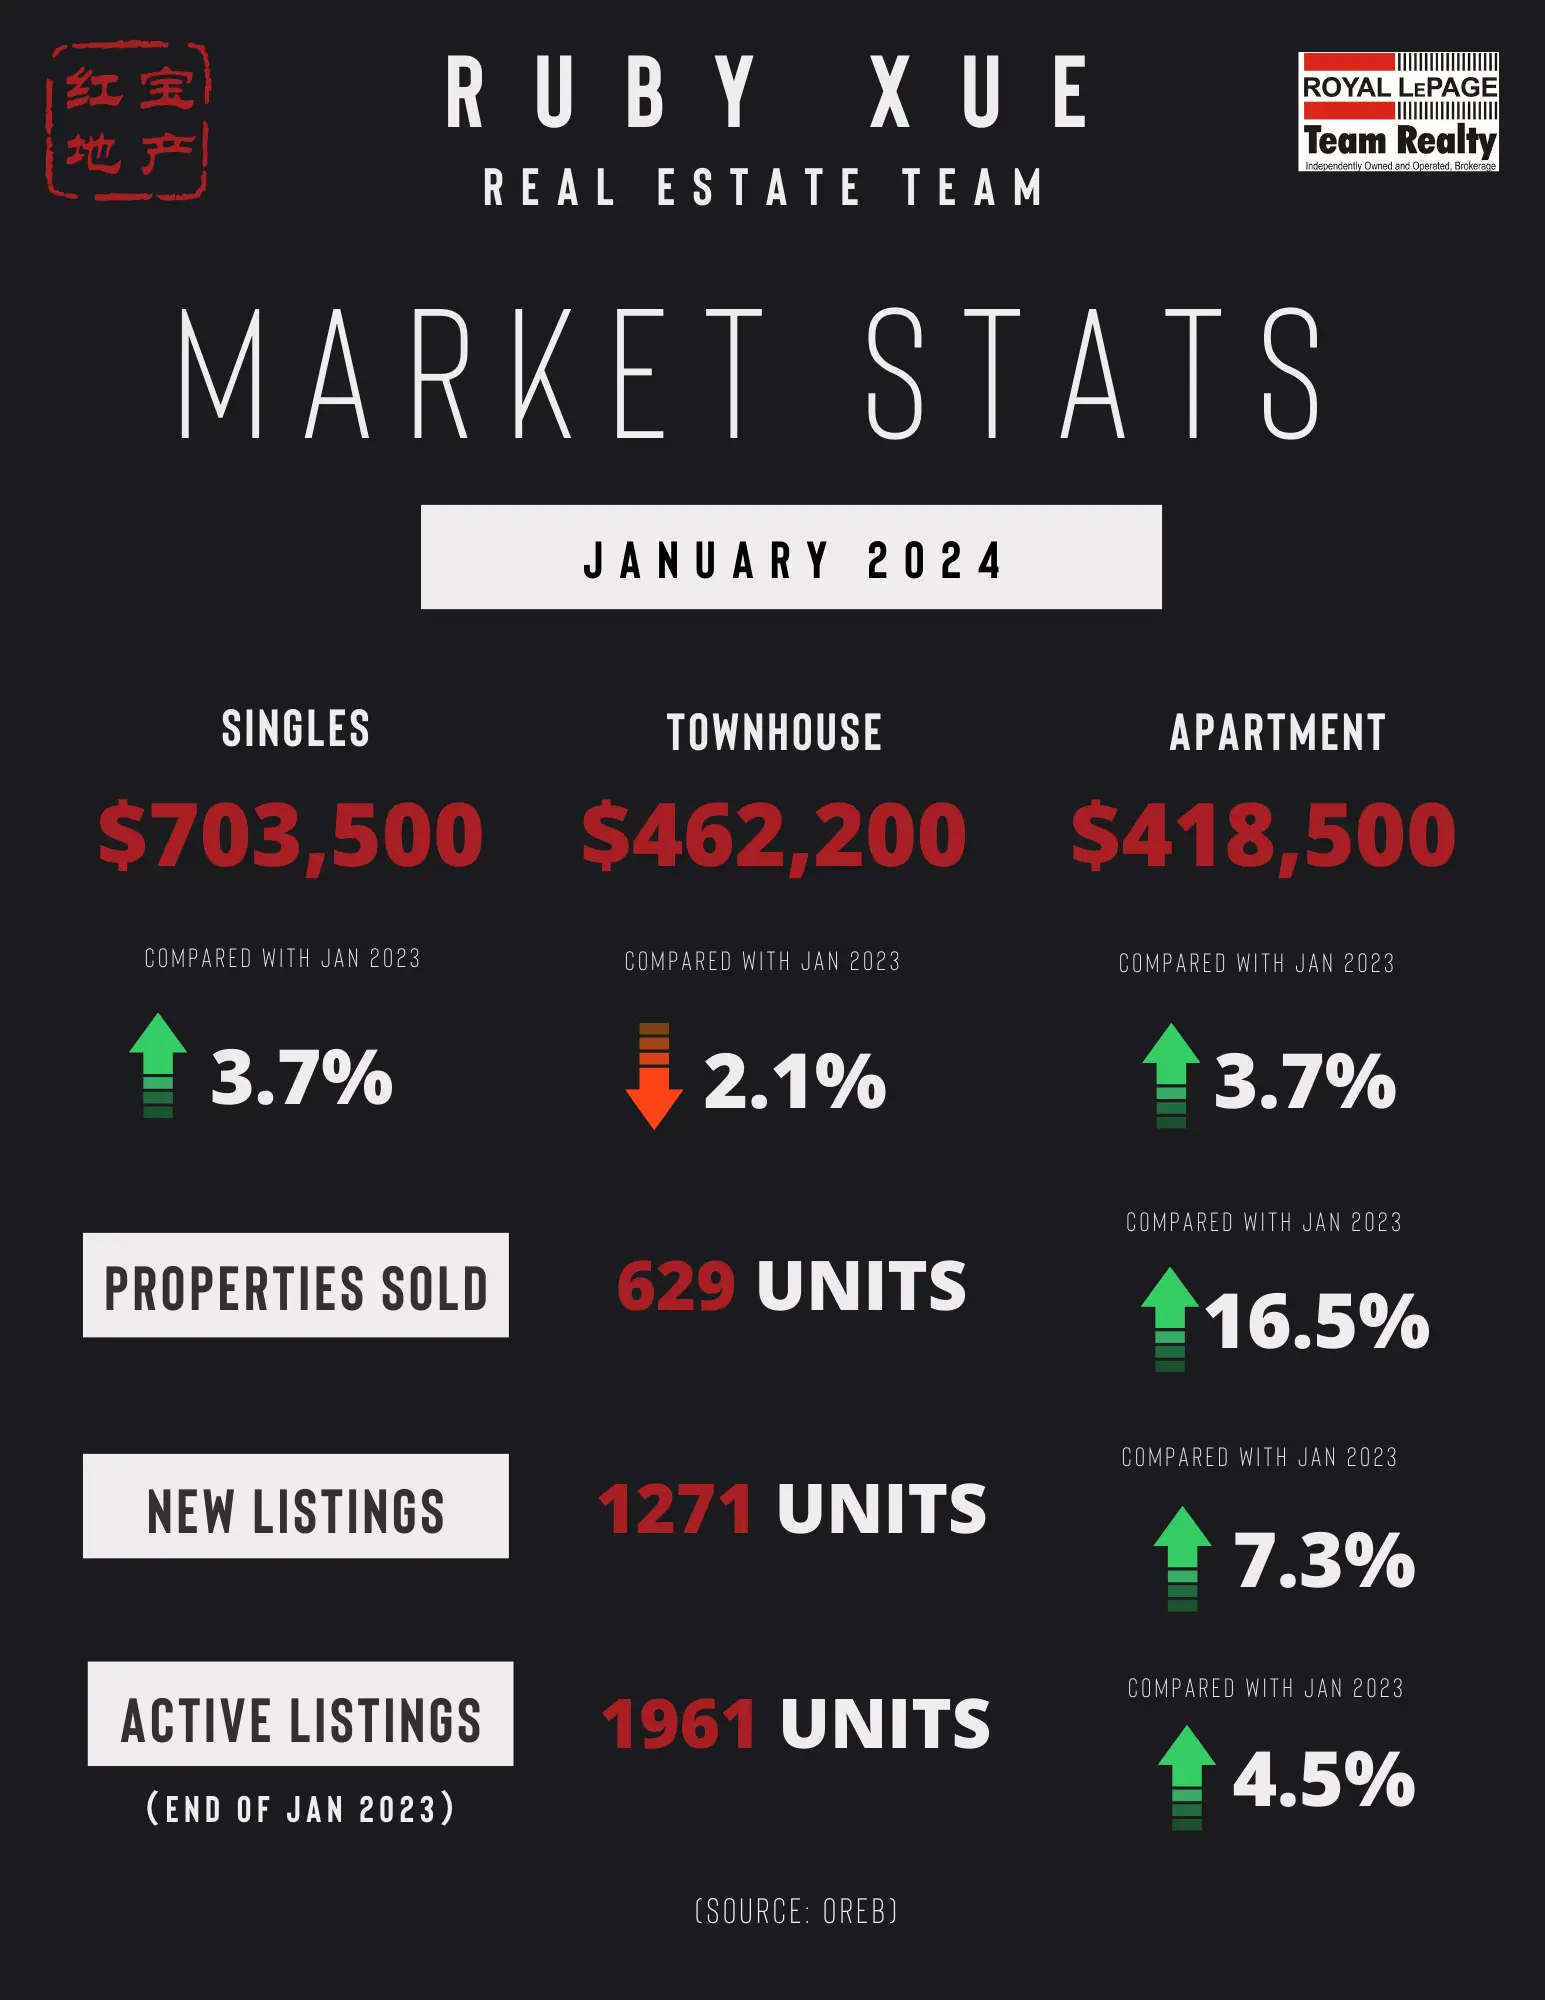
The number of homes sold through the MLS® System of the Ottawa Real Estate Board totaled 629 units in January 2024. This was an increase of 16.5% from January 2023.

Home sales were 10.7% below the five-year average and 3.9% below the 10-year average for the month of January.

“Ottawa’s market activity is seeing positive gains over last year but it’s still a relatively quiet market even by pre-pandemic standards,” says OREB President Curtis Fillier. “While REALTORS® are telling us there’s lots of showing activity — probably thanks in part to the forgiving winter thus far — it’s not all translating to sales. This tells us that buyers are back out there looking, but still approaching cautiously. During the pandemic market, buyers had to move quickly and sometimes settle for a property that didn’t check all their boxes. Today, buyers are using the slower market to take the time needed to find their perfect place. Sellers would be well-advised to adjust their expectations and thoughtfully consider their pricing and timing strategy using the negotiating expertise and hyper-local data their REALTOR® can provide.”

“Ottawa’s market conditions can fluctuate quickly, though, because our supply is chronically low,” adds Brandon Reay, OREB’s policy and external relations manager. “Ottawa needs more suitable and affordable homes to address the housing crisis, and we need to increase density to meet population demands. We can’t restore and grow upon the market activity Ottawa saw five and ten years ago without more houses for people to buy. OREB recommends direct solutions for meaningful policy change, including streamlining the process at the Ontario Land Tribunal, eliminating exclusionary zoning, and permitting four units on residential lots. To meet the aggressive housing targets, we need to close the labour gap with investments in colleges and trade schools. We don’t need any more reactionary and distracting policy, like the federal government’s extension of the foreign buyers ban.”

By the Numbers – Prices:

The MLS® Home Price Index (HPI) tracks price trends far more accurately than is possible using average or median price measures.

  • The overall MLS® HPI composite benchmark price was $621,600 in January 2024, a gain of 3.2% from January 2023.

    • The benchmark price for single-family homes was $703,500, up 3.7% on a year-over-year basis in January.

    • By comparison, the benchmark price for a townhouse/row unit was $462,200, down 2.1% compared to a year earlier.

    • The benchmark apartment price was $418,500, up 3.7% from year-ago levels.

  • The average price of homes sold in January 2024 was $631,722, increasing 1.8% from January 2023.

  • The dollar volume of all home sales in January 2024 was $397.3 million, up 18.6% from the same month in 2023.

OREB cautions that the average sale price can be useful in establishing trends over time but should not be used as an indicator that specific properties have increased or decreased in value. The calculation of the average sale price is based on the total dollar volume of all properties sold. Price will vary from neighbourhood to neighbourhood.

By the Numbers – Inventory & New Listings

  • The number of new listings saw an increase of 7.3% from January 2023. There were 1,271 new residential listings in January 2024. New listings were 17.5% above the five-year average and 0.8% above the 10-year average for the month of January.

  • Active residential listings numbered 1,961 units on the market at the end of January 2024, a gain of 4.5% from the end of January 2023.

  • Active listings were 57.4% above the five-year average and 16.6% below the 10-year average for the month of January. Months of inventory numbered 3.1 at the end of January 2024, down from the 3.5 months recorded at the end of January 2023. The number of months of inventory is the number of months it would take to sell current inventories at the current rate of sales activity.

(SOURCE: OREB)

Read

Ottawa Real Estate - December Stats (2023)

Ottawa MLS® December Home Sales Close Out Year in Steady State. Plus: Ottawa Real Estate Board’s New Leadership

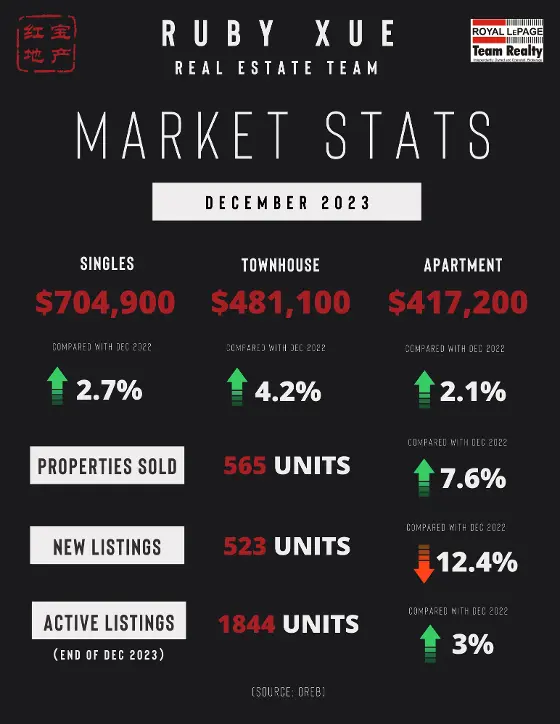
The number of homes sold through the MLS® System of the Ottawa Real Estate Board totaled 565 units in December 2023. This was an increase of 7.6% from December 2022.

Home sales were 16% below the five-year average and 11.9% below the 10-year average for the month of December.

On a year-to-date basis, home sales totaled 11,978 units in all of 2023 — a decline of 11.0% from 2022.

“Ottawa’s resale market closed out the year in a steady, balanced state,” says OREB President Curtis Fillier. “This could be an early indication that consumer confidence is returning. We likely won’t see the full impact of rate stabilization until the second half of 2024, but December’s activity bodes well for a strong year ahead in Ottawa.”

“It hasn’t been the easiest market,” says Ken Dekker, OREB’s Past-President. “And while we probably won’t return to the peak levels seen in 2022, Ottawa’s market is poised to recover any ground lost in the past year. Both buyers and sellers need extra patience right now, but solid opportunities are there.”

By the Numbers – Prices:

The MLS® Home Price Index (HPI) tracks price trends far more accurately than is possible using average or median price measures.

  • The overall MLS® HPI composite benchmark price was $623,900 in December 2023, a modest gain of 2.7% from December 2022.

    • The benchmark price for single-family homes was $704,900, up 2.7% on a year-over-year basis in December.

    • By comparison, the benchmark price for a townhouse/row unit was $481,100, up 4.2% compared to a year earlier.

    • o The benchmark apartment price was $417,200, up 2.1% from year-ago levels.

  • The average price of homes sold in December 2023 was $632,487, increasing 1.7% from December 2022. The more comprehensive year-to-date average price was $667,794, a decline of 5.5% from 2022.

  • The dollar value of all home sales in December 2023 was $357.3 million, up 9.4% from the same month in 2022.

OREB cautions that the average sale price can be useful in establishing trends over time but should not be used as an indicator that specific properties have increased or decreased in value. The calculation of the average sale price is based on the total dollar volume of all properties sold. Price will vary from neighbourhood to neighbourhood.

By the Numbers – Inventory & New Listings

  • The number of new listings saw a major decrease of 12.4% from December2022. There were 523 new residential listings in December 2023. New listings were 4% below the five-year average and 16.1% below the 10-year average for the month of December.

  • Active residential listings numbered 1,844 units on the market at the end of December, a gain of 3.0% from the end of December 2022.

  • Active listings were 55.5% above the five-year average and 17.2% below the 10-year average for the month of December.

  • Months of inventory numbered 3.3 at the end of December 2023, down from the 3.4 months recorded at the end of December 2022. The number of months of inventory is the number of months it would take to sell current inventories at the current rate of sales activity. 

(SOURCE: OREB)

Read

Ottawa Real Estate - November Stats (2023)

Ottawa MLS® Home Sales Stable in November Amid Growing Supply

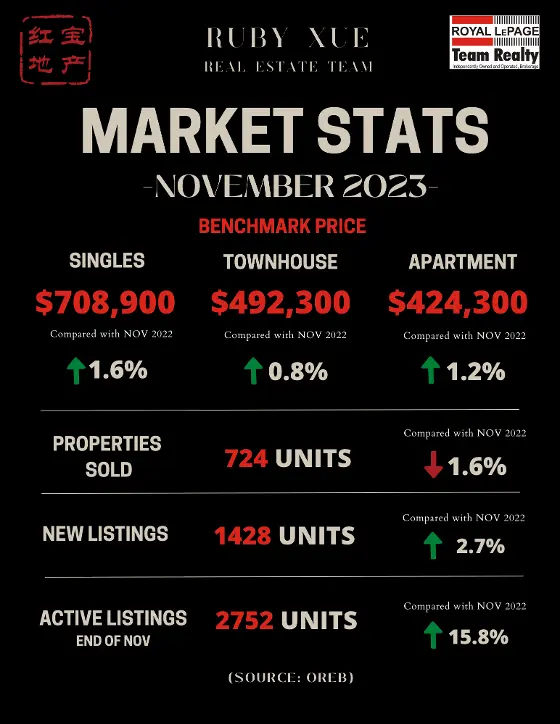
The number of homes sold through the MLS® System of the Ottawa Real Estate Board totaled 724 units in November 2023. This was a small reduction of 1.6% from November 2022.

Home sales were 31.8% below the five-year average and 27.4% below the 10-year average for the month of November.

On a year-to-date basis, home sales totaled 11,421 units after 11 months of the year. This was a decline of 11.7% from the same period in 2022.

“Sales are performing as expected with the arrival of colder months, and an uptick in new and active listings is bringing more choice back into the market,” says OREB President Ken Dekker. “While more choice may mean the pace of buying and selling has slowed, that doesn’t mean people looking to enter or upgrade in the market should sit back. Prospective buyers or those looking to upgrade have an opportunity to collaborate with their REALTOR® to carefully explore the market, identify the ideal property, and negotiate an attractive deal at their own pace. Sellers will have to manage their expectations regarding the quantity of offers and speed of transactions, and their REALTOR® is the best resource to help them confidently price and prepare their home for a quality sale.”

By the Numbers – Prices:

The MLS® Home Price Index (HPI) tracks price trends far more accurately than is possible using average or median price measures.

  • The overall MLS® HPI composite benchmark price was $628,900 in November 2023, nearly unchanged, up only 1.4% from November 2022.

    • The benchmark price for single-family homes was $708,900, up 1.6% on a year-over-year.

    • By comparison, the benchmark price for a townhouse was $492,300, nearly unchanged, up 0.8% compared to a year earlier.

    • The benchmark apartment price was $424,300, up 1.2% from year-ago levels.

  • The average price of homes sold in November 2023 was $633,138, decreasing 0.8% from November 2022. The more comprehensive year-to-date average price was $669,536, a decline of 5.7% from 11 months of 2022.

  • The dollar value of all home sales in November 2023 was $458.4 million, down 2.4% from the same month in 2022.

OREB cautions that the average sale price can be useful in establishing trends over time but should not be used as an indicator that specific properties have increased or decreased in value. The calculation of the average sale price is based on the total dollar volume of all properties sold. Price will vary from neighbourhood to neighbourhood.

By the Numbers – Inventory & New Listings

  • The number of new listings saw an increase of 2.7% from November 2022. There were 1,428 new residential listings in November 2023. New listings were 8.4% above the five-year average and 10.4% above the 10-year average for the month of November.

  • Active residential listings numbered 2,752 units on the market at the end of November, a sizable gain of 15.8% from the end of November 2022.

  • Active listings were 53.9% above the five-year average and 6.7% below the 10-year average for the month of November. Active listings haven’t been this high in the month of November in more than five years.

  • Months of inventory numbered 3.8 at the end of November 2023, up from the 3.2 months recorded at the end of November 2022 and above the long-run average of 3.3 months for this time of year. The number of months of inventory is the number of months it would take to sell current inventories at the current rate of sales activity.

 (SOURCE: OREB)


Read

Ottawa Real Estate - October Stats (2023)

Ottawa MLS® October Home Sales Show Typical Lull

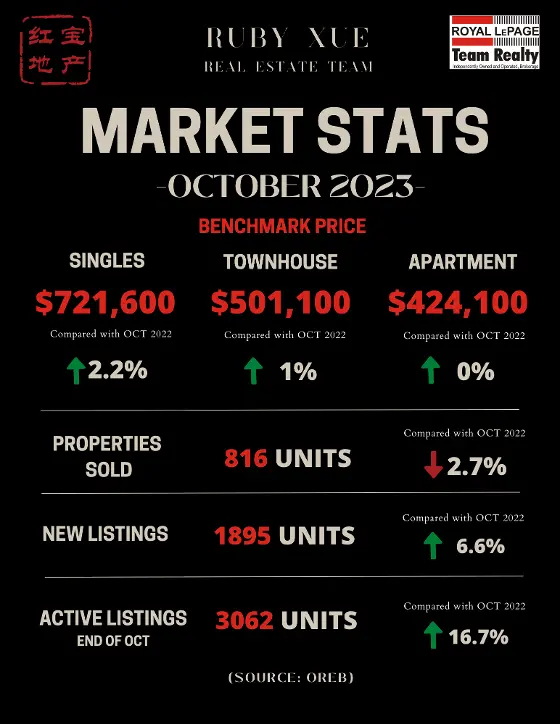
The number of homes sold through the MLS® System of the Ottawa Real Estate Board totaled 816 units in October 2023. This was a small reduction of 2.7% from October 2022.

Home sales were 36.4% below the five-year average and 30.8% below the 10-year average for the month of October.

On a year-to-date basis, home sales totaled 10,700 units over the first 10 months of the year. This was a substantial decline of 12.3% from the same period in 2022.

“Life is expensive these days, which likely has both buyers and sellers staying put,” says Ken Dekker, OREB President. “We’re seeing a slow decline in sales activity but it’s minimal and not unexpected for this time of year. Prices are adjusting and coming down, which is also indicative of the types of homes that are selling — apartments seeing the largest increase in sales activity over last October. While Ottawa’s inventory is slowly building, chronic supply issues mean there’s always an undercurrent of demand. Don’t let the lull fool you: now is a prime time for buyers to be looking for opportunities before the current carries us from a balanced market into seller’s territory.”

By the Numbers – Prices:

The MLS® Home Price Index (HPI) tracks price trends far more accurately than is possible using average or median price measures.

  • The overall MLS® HPI composite benchmark price was $638,600 in October 2023, nearly unchanged, up only 1.8% from October 2022.

    1. The benchmark price for single-family homes was $721,600, up 2.2% on a year-over-year basis in September.

    2. By comparison, the benchmark price for a townhouse was $501,100, nearly unchanged, up 1% compared to a year earlier.

    3. The benchmark apartment price was $424,100, unchanged from year-ago levels.

  • The average price of homes sold in October 2023 was $660,836, increasing 2.9% from October 2022. The more comprehensive year-to-date average price was $671,983, a decline of 5.9% from the first ten months of 2022.

  • The dollar value of all home sales in October 2023 was $539.2 million, unchanged from the same month in 2022.

OREB cautions that the average sale price can be useful in establishing trends over time but should not be used as an indicator that specific properties have increased or decreased in value. The calculation of the average sale price is based on the total dollar volume of all properties sold. Price will vary from neighbourhood to neighbourhood.

By the Numbers – Inventory & New Listings:

  • The number of new listings saw an increase of 6.6% from October 2022. There were 1,895 new residential listings in October 2023. New listings were 2% above the five-year average and 5.4% above the 10-year average for the month of October.

  • Active residential listings numbered 3,062 units on the market at the end of October, a sizable gain of 16.7% from the end of October 2022. Active listings haven’t been this high in the month of October in more than five years. 

  • Active listings were 43.8% above the five-year average and 10.9% below the 10-year average for the month of October.

  • Months of inventory numbered 3.8 at the end of October 2023, just up from the 3.1 months recorded at the end of October 2022. The number of months of inventory is the number of months it would take to sell current inventories at the current rate of sales activity.

(SOURCE: OREB)
Read

Ottawa Real Estate - September Stats (2023)

Ottawa MLS® Home Sales Hold Steady in Lackluster September

The number of homes sold through the MLS® System of the Ottawa Real Estate Board (OREB) totaled 946 units in September 2023. This was unchanged from September 2022.

Home sales were 29.6% below the five-year average and 23.6% below the 10-year average for the month of September.

On a year-to-date basis, home sales totaled 9,889 units over the first nine months of the year. This was a large decline of 13% from the same period in 2022.

“Sales activity came in right on par with where it stood at the same time last year but was still running well below typical levels for a September,” said Ken Dekker, OREB President. “New listings have surged in the past several months, which has caused overall inventories to begin gradually rising again. However, available supply is still low by historical standards, and we have ample room to absorb more listings coming on the market. Our market is also right in the middle of balanced territory, and while MLS® Benchmark prices are down from last year they are still trending at about the same levels from 2021.”

By the Numbers – Prices:
The MLS® Home Price Index (HPI) tracks price trends far more accurately than is possible using average or median price measures.

  • The overall MLS® HPI composite benchmark price was $643,600 in September 2023, nearly unchanged, up only 0.5% compared to September 2022.

    • The benchmark price for single-family homes was $727,500, essentially unchanged, up just 0.6% on a year-over-year basis in September.

    • By comparison, the benchmark price for townhouse/row units was $510,900, a small gain of 2.5% compared to a year earlier, while the benchmark apartment price was $422,300, falling by 1.1% from year-ago levels.

  • The average price of homes sold in September 2023 was $675,412, increasing by 2.7% from September 2022. The more comprehensive year-to-date average price was $672,837, a decline of 6.5% from the first nine months of 2022.

  • The dollar value of all home sales in September 2023 was $638.9 million, up modestly by 2.7% from the same month in 2022.

OREB cautions that the average sale price can be useful in establishing trends over time but should not be used as an indicator that specific properties have increased or decreased in value. The calculation of the average sale price is based on the total dollar volume of all properties sold. Price will vary from neighbourhood to neighbourhood.

By the Numbers – Inventory & New Listings

  • The number of new listings saw an increase of 9.8% from September 2022. There were 2,259 new residential listings in September 2023. New listings were 4.8% above the five-year average and 7% above the 10-year average for the month of September.

  • Active residential listings numbered 2,997 units on the market at the end of September, a sizable gain of 14% from the end of September 2022. Active listings haven’t been this high in the month of September in five years.

  • Active listings were 33.9% above the five-year average and 18.5% below the 10-year average for the month of September.

  • Months of inventory numbered 3.2 at the end of September 2023, up from the 2.8 months recorded at the end of September 2022 and below the long-run average of 3.3 months for this time of year. The number of months of inventory is the number of months it would take to sell current inventories at the current rate of sales activity.

(SOURCE: OREB)

Read

Ottawa Real Estate - August Stats (2023)

Ottawa Resale Market Stalls in August, Supply Challenges Persist

Members of the Ottawa Real Estate Board (OREB) sold 1,196 residential properties in August through the Board’s Multiple Listing Service® (MLS®) System, compared with 1,130 in August 2022, an increase of 6%. August’s sales included 903 in the freehold-property class, up 7% from a year ago, and 293 in the condominium-property category, a 2% increase from August 2022. The five-year average for total unit sales in August is 1,525.

“Sales activity was up marginally on a year-over-year basis in August but remained well below the historical average for this time of year,” says Ken Dekker, OREB President. “There is no shortage of demand given increased immigration and the large Canadian population cohort entering the market. The lack of suitable, affordable housing is a hindrance. High borrowing costs and economic uncertainty are impacting both sellers and buyers, which we expect will continue to result in further market fluctuations.”

Janice Myers, OREB CEO, highlights that these latest figures coincide with the City of Ottawa’s allocation of $110 million for affordable housing. “Even if interest rates were to drop and the economy stabilized, housing will remain out of reach for many Ottawa residents. Collaboration among all levels of government and stakeholders is vital to improving affordability for homeowners and tenants alike. And we need to expand provincial regulations, allowing four or more residential dwelling units on serviced lots, to promote higher-density housing.”

By the Numbers

Average Prices*:

  • The average sale price for a freehold-class property in August was $709,739, an increase of 0.5% from 2022, and a 5.6% decrease over July 2023 prices.

  • The average sale price for a condominium-class property was $425,968 an increase of 1% from a year ago, although 1.4% lower than July 2023 prices.

  • With year-to-date average sale prices at $732,220 for freeholds and $432,571 for condos, these values represent an 8% decrease over 2022 for freehold-class properties and a 5.5% decrease for condominium-class properties.


Inventory & New Listings:

  • August’s new listings (2,228) increased 7% over August 2022 (2,090) and were on par with last month (2,234). The 5-year average for new listings in August is 2,177.

  • Months of Inventory for the freehold-class properties has increased to 3 months from 2.9 months in August 2022 and 2.7 months in July 2023.

  • Months of Inventory for condominium-class properties remains on par with August 2022 at 2.2 months, a slight decrease from 2.3 months in July 2023.

  • Days on market (DOM) for freeholds have increased to 31 days from 25 days in August 2022 and 26 days in July 2023.

  • Days on market (DOM) for condos have increased to 29 days from 28 days in August 2022 and 28 days in July 2023.


REALTORS® also help with finding rentals and vetting potential tenants. Since the beginning of the year, OREB Members have assisted clients with renting 4,571 properties compared to 4,172 last year at this time, an increase of 10%.

* OREB cautions that the average sale price can be useful in establishing trends over time but should not be used as an indicator that specific properties have increased or decreased in value. The calculation of the average sale price is based on the total dollar volume of all properties sold. Price will vary from neighbourhood to neighbourhood.

(Source: OREB)

Read

What Do These Numbers Mean for You?

Ottawa's most trusted real estate agent

Whether you're a seller trying to pinpoint the perfect list price or a buyer looking for the right opportunity, we can provide the specific insight you need.

This website may only be used by consumers that have a bona fide interest in the purchase, sale, or lease of real estate of the type being offered via the website. The data relating to real estate on this website comes in part from the MLS® Reciprocity program of the PropTx MLS®. The data is deemed reliable but is not guaranteed to be accurate.