RSS

Ottawa Real Estate - July Stats (2023)

Stabilized July Resale Market Showing Positive Price Gains

Members of the Ottawa Real Estate Board (OREB) sold 1,263 residential properties in July through the Board’s Multiple Listing Service® (MLS®) System, compared with 1,102 in July 2022, an increase of 15%. July’s sales included 979 in the freehold-property class, up 18% from a year ago, and 284 in the condominium-property category, a 6% increase from July 2022. The five-year average for total unit sales in July is 1,621.

“Both transactions and average prices are up from last July indicating consumers remain confident in the market notwithstanding the two recent quarter-percent interest rate hikes by the Bank of Canada. We’re only a month into the third quarter, but based on July’s positive indicators, we are likely to see solid year-over-year results in the second half,” says Ottawa Real Estate Board President Ken Dekker.

By the Numbers – Average Prices*:

  • The average sale price for a freehold-class property in July was $754,188, an increase of 5% from 2022, and a 1% increase over June 2023 prices.

  • The average sale price for a condominium-class property was $435,094 an increase of 2% from a year ago, although 3% lower than June 2023 prices.

  • With year-to-date average sale prices at $735,103 for freeholds and $433,447 for condos, these values represent a 9% decrease over 2022 for freehold-class properties and a 6% decrease for condominium-class properties.


“July’s average prices are showing positive gains over last year, and year-to-date numbers, as expected, are still closing the gap from the peak pandemic market activity of early 2022. Additionally, inventory continues to climb steadily as new listings are added to the housing stock, creating more options for homebuyers. August may be a slower month in Ottawa, but I wouldn’t take a vacation from shopping for your home.”

By the Numbers – Inventory & New Listings:

  • July’s new listings (2,234) were 6% lower than July 2022 (2,364) and down 19% from June 2023 (2,755). The 5-year average for new listings in July is 2,336.

  • Months of Inventory for the freehold-class properties has decreased to 2.7 months from 2.9 months in July 2022 but increased from 2.1 months in June 2023.

  • Months of Inventory for condominium-class properties has decreased to 2.3 months from 2.5 months in July 2022, but is up from 1.4 months in June 2023.

  • Days on market (DOM) for freeholds have increased to 26 days from 20 days in July 2022 and 23 days from June 2023.

  • Days on market (DOM) for condos have increased to 28 days from 20 days in July 2023 and 27 days in June 2023.


“Although we are in a sellers’ market again, the pandemic’s frenzy has calmed considerably. Sellers need to manage their expectations with true market activity — not every property will automatically see multiple offers or immediate sales. Ultimately, a property’s price is determined by how much a buyer is willing to pay. Using the marketing and negotiation skills of a professional licensed REALTOR® is instrumental for both buyers and sellers in this fluid market.”

REALTORS® also help with finding rentals and vetting potential tenants. Since the beginning of the year, OREB Members have assisted clients with renting 3,921 properties compared to 3,528 last year at this time, an increase of 11%.

(Source: OREB)

Read

Ottawa Real Estate - June Stats (2023)

June’s Resale Market Eases into Summer

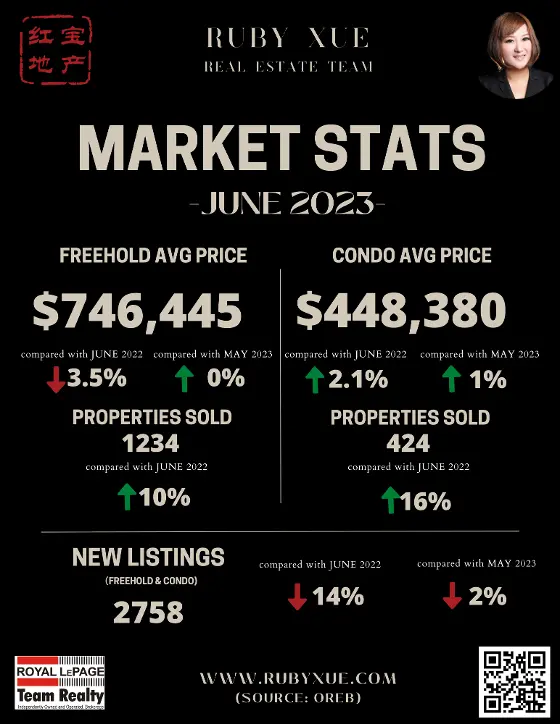
Members of the Ottawa Real Estate Board (OREB) sold 1,658 residential properties in June through the Board’s Multiple Listing Service® (MLS®) System, compared with 1,493 in June 2022, an increase of 11%. June’s sales included 1,234 in the freehold-property class, up 10% from a year ago, and 424 in the condominium-property category, a 16% increase from June 2022. The five-year average for total unit sales in June is 1,881.

“Although June’s transactions surpassed last year’s, the number of sales, average prices, and new listings declined on a week-to-week basis over the course of the month. Compounded by the typical summer decline in activity, the Bank of Canada’s interest rate adjustment at the beginning of the month may have also flattened the curve,” says Ottawa Real Estate Board President Ken Dekker.

By the Numbers – Average Prices*:

  • The average sale price for a freehold-class property in June was $746,445, a decrease of 4% from 2022, but still on par with May 2023 prices.

  • The average sale price for a condominium-class property was $448,380, an increase of 2% from a year ago and up 1% over May 2023 prices.

  • With year-to-date average sale prices at $731,847 for freeholds and $432,885 for condos, these values represent a 10% decrease over 2022 for freehold-class properties and a 7% decrease for condominium-class properties.

“Supply is trending in the right direction. The increase in inventory is encouraging and indicates sellers have confidence in the market. A growing resale housing stock will result in more selection for buyers and more sales,” Dekker suggests.

By the Numbers – Inventory & New Listings:

  • June’s new listings (2,758) were 14% lower than June 2022 (3,212) and down 2% from May 2023 (2,822). The 5-year average for new listings in June is 2,802.

  • Months of Inventory for the freehold-class properties has increased to 2.1 months from 1.9 months in June 2022 and 1.5 months in May 2023.

  • Months of Inventory for condominium-class properties has decreased to 1.4 months from 1.6 months in June 2022, although up from 1.3 months in May 2023.

  • Days on market (DOM) for freeholds stayed on par with last month at 23 days and increased to 27 days for condos compared to last month (26 days).


“We are looking forward to a strong second half of 2023 in terms of sales volume and prices compared to last year. Whichever side of the transaction you are on, the advice of a professional REALTOR® who has their pulse on the week-to-week variabilities in Ottawa’s resale market is priceless.”

REALTORS® also help with finding rentals and vetting potential tenants. Since the beginning of the year, OREB Members have assisted clients with renting 3,336 properties compared to 2,919 last year at this time, an increase of 14%.

(SOURCE: OREB)

Read

Ottawa Real Estate - May Stats (2023)

Ottawa resale market heats up in May

Sales increase for the first time since February 2022

Members of the Ottawa Real Estate Board (OREB) sold 1,939 residential properties in May through the Board’s Multiple Listing Service® (MLS®) System, compared with 1,830 in May 2022, an increase of 6%. May’s sales included 1,477 in the freehold-property class, up 8% from a year ago, and 462 in the condominium-property category, a 1% increase from May 2022. The five-year average for total unit sales in May is 1,961.

“Typically the highest-selling month, May’s transactions did not disappoint,” says Ken Dekker, Ottawa Real Estate Board President. “This month we saw the first year-over-year unit sales volume increase since February 2022. It is a promising year for sellers barring any interest rate adjustments, as we saw a correlated drop in sales every time there was an interest rate hike in 2022.”

“However, with only five to six weeks of inventory, we are in a strong seller’s market. With the pent-up high demand and sales volume increasing, we are likely to see upward pressure on prices as demand continues to outstrip supply.”

By the Numbers – Average Prices*:

  • The average sale price for a freehold-class property in May was $745,902, a decrease of 7% from 2022, but still on par with April 2023 prices.

  • The average sale price for a condominium-class property was $442,859, decreasing 6% from a year ago. However, it marks a 2% increase over April 2023 prices.

  • With year-to-date average sale prices at $727,728 for freeholds and $428,394 for condos, these values represent a 12% decrease over 2022 for freehold-class properties and a 9% decrease for condominium-class properties.


“We are not seeing steep price escalations yet. May’s average prices stayed on par with April’s, although prices are well over what we saw at the end of 2022. With demand mounting in Ottawa’s chronically undersupplied market, I expect the average sale price will surpass last year’s figures for a month over the same month in the latter half of 2023 again—provided we do not see interest rate hikes.”

By the Numbers – Inventory & New Listings:

  • May’s new listings (2,822) were 9% lower than May 2022 (3,117) and up 32% from April 2023 (2,140). The 5-year average for new listings in May is 2,922.

  • Months of Inventory for the freehold-class properties has increased to 1.5 months from 1.2 months in May 2022 but down from 1.9 months in April 2023.

  • Months of Inventory for condominium-class properties has increased to 1.3 months from 1 month in May 2022, although down from 1.9 months in April 2023.

  • Days on market (DOM) for freeholds decreased from 27 to 23 days and 33 to 26 days for condos compared to last month.

“Given our housing stock challenges, some neighbourhoods are again in multiple offer territory. REALTORS® have up-to-the-minute market data and are best positioned to help both buyers and sellers in this evolving competitive resale market.”

REALTORS® also help with finding rentals and vetting potential tenants. Since the beginning of the year, OREB Members have assisted clients with renting 2,731 properties compared to 2,230 last year at this time, an increase of 22%.

* OREB cautions that the average sale price can be useful in establishing trends over time but should not be used as an indicator that specific properties have increased or decreased in value. The calculation of the average sale price is based on the total dollar volume of all properties sold. Price will vary from neighbourhood to neighbourhood.

(SOURCE: OREB)

Read

Ottawa Real Estate - April Stats (2023)

Resale Market Springs Back in Favour of Sellers

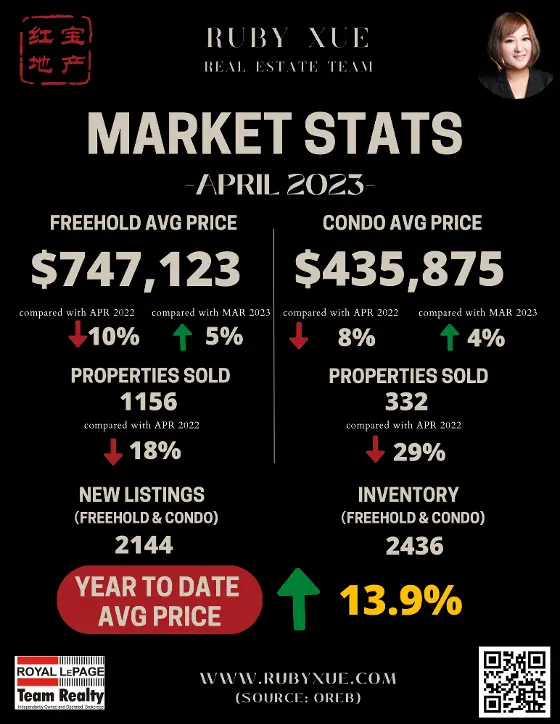
Members of the Ottawa Real Estate Board (OREB) sold 1,488 residential properties in April through the Board’s Multiple Listing Service® (MLS®) System, compared with 1,876 in April 2022, a decrease of 21%. April’s sales included 1,156 in the freehold-property class, down 18% from a year ago, and 332 in the condominium-property category, a decrease of 29% from April 2022. The five-year average for total unit sales in April is 1,739.

“Ottawa’s resale market is on a steady upward trajectory, narrowing the comparison gap to peak pandemic activity in 2022. However, with new listings not keeping pace, the available housing stock is declining, and with less than two months of inventory — we’re back into seller’s market territory,” says Ottawa Real Estate Board President Ken Dekker.

By the Numbers – Average Prices*:

  • Average prices have increased by 13.9% in four months since the market low in December 2022.

  • The average sale price for a freehold-class property in April was $747,123, a decrease of 10% from 2022. However, it marks a 5% increase over March 2023.

  • The average sale price for a condominium-class property was $435,875, decreasing 8% from a year ago, but still a 4% gain over March 2023.

  • With year-to-date average sale prices at $718,633 for freeholds and $421,722 for condos, these values represent a 13% decrease over 2022 for freehold-class properties and a 10% decrease for condominium-class properties.


“Upward pressure on sales prices continues with average prices increasing for the fourth month since the market low in December. Additionally, multiple offer situations have returned to certain neighbourhoods and overall days on market are maintaining their downward trend. There continues to be low inventory in certain property classes and new product is coming to the market at a slower rate, which is affecting supply.”

By the Numbers – Inventory & New Listings:

  • April’s new listings (2,144) were 25% lower than April 2022 (2,843) and up 3% from March 2023 (2,089). The 5-year average for new listings in April is 2,575.

  • Months of Inventory for the freehold-class properties has increased to 1.9 months from 0.9 months in April 2022 but down from 2.3 months in March.

  • Months of Inventory for condominium-class properties has increased to 1.9 months from 0.8 months in April 2022, although down from 2.1 months in March.

  • Days on market (DOM) for freeholds decreased from 34 to 27 days and 39 to 33 days for condos compared to last month.


“These numbers are static, snapshots in time. REALTORS® can give buyers and sellers a fulsome day-to-day picture of how the market is shifting and heating up this season. They have their fingers on the pulse of each neighbourhood in the city and can help buyers and sellers make localized, strategic, data-informed decisions.”

REALTORS® also help with finding rentals and vetting potential tenants. Since the beginning of the year, OREB Members have assisted clients with renting 2,151 properties compared to 1,786 last year at this time, an increase of 20%.

* OREB cautions that the average sale price can be useful in establishing trends over time but should not be used as an indicator that specific properties have increased or decreased in value. The calculation of the average sale price is based on the total dollar volume of all properties sold. Price will vary from neighbourhood to neighbourhood.

(SOURCE: OREB)

Read

Ottawa Real Estate - March Stats (2023)

March Resales: Signs of Spring Surge Sprouting

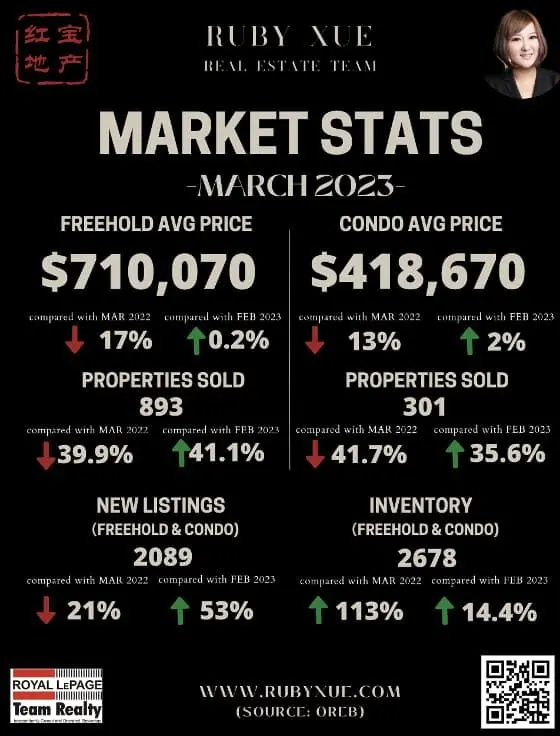
Members of the Ottawa Real Estate Board (OREB) sold 1,194 residential properties in March through the Board’s Multiple Listing Service® (MLS®) System, compared with 2,003 in March 2022, a decrease of 40%. March’s sales included 893 in the freehold-property class, down 40% from a year ago, and 301 in the condominium-property category, a decrease of 42% from March 2022. March sales transactions increased 40% over February. The five-year average for total unit sales in March is 1,698.

“The recent rise in transactions is a sign of typical spring activity, even if we’re behind the pandemic peaks of 2022. As spring unfolds, so too will a clearer picture of Ottawa’s balanced market state,” says Ottawa Real Estate Board President Ken Dekker.

By the Numbers – Average Prices*:

  • The average sale price for a freehold-class property in March was $710,070, a decrease of 17% from 2022. However, it marks a 0.2% increase over February 2023. Average freehold prices have climbed approximately 8% during Q1 2023 over December 2022’s market low.

  • The average sale price for a condominium-class property was $418,670, decreasing 13% from a year ago, but still a 2% gain over February 2023.

  • With year-to-date average sale prices at $701,837 for freeholds and $414,698 for condos, these values represent a 16% decrease over 2022 for freehold-class properties and an 11% decrease for condominium-class properties.


“As evidenced by the recent climb in freehold prices, Ottawa’s resale market is stabilizing along with the interest rate. Condos remain steady due to their lower price point, there’s more affordability based on the current interest rate structure. Prices are certainly headed in the right direction—if you are looking forward.”

By the Numbers – Inventory & New Listings:

  • Months of Inventory for the freehold-class properties has increased to 2.3 months from 0.6 months in March 2022.

  • Months of Inventory for condominium-class properties has increased to 2.8 months from 0.6 months in March 2022.

  • March’s new listings (2,089) were 21% lower than March 2022 (2,632) and up 53% from February 2023 (1,366). The 5-year average for new listings in March is 2,474.

  • Days on market (DOM) for freeholds decreased from 37 to 34 days and 43 to 39 days for condos compared to last month.


“Well-priced and well-prepared homes are selling. REALTORS® have up-to-the-minute statistics to ensure sellers are positioning themselves at the current market value based on recent sales and hyper-local market comparisons. Buyers can benefit from the same data along with their negotiation expertise to guarantee they are receiving the best value for their dollar.”

REALTORS® also help with finding rentals and vetting potential tenants. Since the beginning of the year, OREB Members have assisted clients with renting 1,599 properties compared to 1,291 last year at this time, an increase of 24%.

* OREB cautions that the average sale price can be useful in establishing trends over time but should not be used as an indicator that specific properties have increased or decreased in value. The calculation of the average sale price is based on the total dollar volume of all properties sold. Price will vary from neighbourhood to neighbourhood.

(SOURCE: OREB)

Read

Ottawa Real Estate - February Stats (2023)

Resale Market Stabilizes in February with a Glimmer of Hope for Buyers and Sellers Alike!

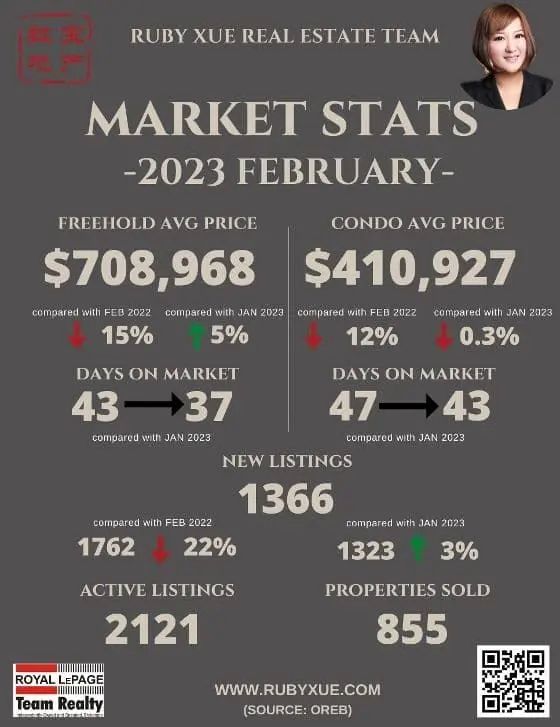
Members of the Ottawa Real Estate Board (OREB) sold 855 residential properties in February through the Board’s Multiple Listing Service® (MLS®) System, compared with 1,411 in February 2022, a decrease of 39%. February’s sales included 633 in the freehold-property class, down 42% from a year ago, and 222 in the condominium-property category, a decrease of 31% from February 2022. The five-year average for total unit sales in February is 1,157.

“We’re going to see declines in transactions and prices when we compare current figures to last February — the height of the pandemic resale market activity,” says Ottawa Real Estate Board’s President Ken Dekker. “On the other hand, with the Bank of Canada holding interest rates steady, prospective buyers have more budget certainty to work with as we head into the spring market.”

By the Numbers – Average Prices*:

  • The average sale price for a freehold-class property in February was $708,968, a decrease of 15% from 2022. However, it marks a 5% increase over January 2023.

  • The average sale price for a condominium-class property was $410,927, decreasing 12% from a year ago.

  • With year-to-date average sale prices at $695,086 for freeholds and $411,449 for condos, these values represent a 14% decrease over 2022 for freehold-class properties and a 10% decrease for condominium-class properties.


“The average price increase for freeholds over January could be an indicator that buyers have normalized to the current interest rates. And perhaps, it’s a glimmer of more activity to come in the months ahead.”

By the Numbers – Inventory & New Listings:

  • Months of Inventory for the freehold-class properties has increased to 2.8 months from 0.7 months in February 2022.

  • Months of Inventory for condominium-class properties has increased to 2.5 months from 0.7 months in February 2022.

  • February’s new listings (1,366) were 22% lower than February 2022 (1,762) and up 3% from January 2023 (1,323). The 5-year average for new listings in February is 1,632.

  • Days on market (DOM) for freeholds decreased from 43 to 37 days and 47 to 43 days for condos compared to last month.


“A decrease in the days on market, paired with fewer new listings entering the market, is good news for sellers,” says Dekker. “However, if that trend continues to impact our supply stock and we don’t get more inventory, our otherwise balanced market could swing back into seller’s territory — but it’s too early to predict.”

“The best advice for sellers and buyers in today’s market is to pay close attention to the comparison and competition insights only a REALTOR® can offer. Ottawa is made up of many micro-markets, and neighbourhood-level data is vital to standing out and closing deals.”

REALTORS® also help with finding rentals and vetting potential tenants. Since the beginning of the year, OREB Members have assisted clients with renting 995 properties compared to 800 last year at this time, an increase of 24%.

* OREB cautions that the average sale price can be useful in establishing trends over time but should not be used as an indicator that specific properties have increased or decreased in value. The calculation of the average sale price is based on the total dollar volume of all properties sold. Price will vary from neighbourhood to neighbourhood.

(SOURCE: OREB)

Read

Ottawa Real Estate - January Stats (2023)

Resale Market Starts Slow as Buyers Remain Cautious

Members of the Ottawa Real Estate Board (OREB) sold 606 residential properties in January through the Board’s Multiple Listing Service® (MLS®) System, compared with 933 in January 2022, a decrease of 35%. January’s sales included 460 in the freehold-property class, down 30% from a year ago, and 146 in the condominium-property category, a decrease of 47% from January 2022. The five-year average for total unit sales in January is 819.

“January’s marked slow down in unit sales over 2022 indicates potential home buyers are taking their time,” says OREB President Ken Dekker. “While last month saw the culmination of the succession of interest rate hikes announced by the Bank of Canada, affordability remains a factor. They may be waiting for a shift in listing prices. They’re being cautious in uncertain conditions.”

By the Numbers – Average Prices*:

  • The average sale price for a condominium-class property in January was $412,244, a decrease of 8% from 2022.

  • The average sale price for a freehold-class property was $676,272, decreasing 12% from a year ago.


“Despite the decrease in average prices, the market should not be considered on a downward slide,” says Dekker. “A hyper COVID-19 seller’s market is now leveling out to our current balanced market state.”

“On a positive note, in comparison to December’s figures, January’s average price of freehold properties increased by 3%. The average price of condos did fall by 5% compared to December but condo pricing tends to fluctuate more due to the small data set.”

By the Numbers – Inventory & New Listings:

  • Months of Inventory for the freehold-class properties has increased to 3.8 months from 0.9 months in January 2022.

  • Months of Inventory for condominium-class properties has increased to 3.8 months from 0.8 months in January 2022.

  • January’s new listings (1,324) were 16% higher than 2022 (1,142) and up 89% from December 2022 (699). The 5-year average for new listings in January is 1,233.


“Ottawa’s inventory and days on market figures are typical for a balanced market and another sign that buyers are no longer racing to put in an offer,” says Dekker. “The increase in new listings and supply is a boon for home buyers, who now have more selection and the ability to put in conditions at a less frantic pace. REALTORS® are an essential resource in finding the right property for the right buyer. On the other side of the transaction, REALTORS® can help sellers with hyper-local insights about how to sell in their neighbourhood at a time when pricing is key.”

More people are turning to REALTORS® for help renting properties — 509 this month compared to 410 in January 2022, an increase of 24%. “Even with the increase in housing stock, the tighter rental market is another indication that affordability is keeping some potential buyers on the sidelines.”

* OREB cautions that the average sale price can be useful in establishing trends over time but should not be used as an indicator that specific properties have increased or decreased in value. The calculation of the average sale price is based on the total dollar volume of all properties sold. Price will vary from neighbourhood to neighbourhood.

(SOURCE: OREB)

Read

Ottawa Real Estate-December Stats and Facts (2022)

Members of the Ottawa Real Estate Board (OREB) sold 601 residential properties in December through the Board’s Multiple Listing Service® (MLS®) System, compared with 857 in December 2021, a decrease of 30%. December’s sales included 466 in the residential-property class, down 22% from a year ago, and 135 in the condominium-property category, a decrease of 48% from December 2021. The five-year average for total unit sales in December is 775.

Residential and condo resales in 2022 totaled 15,288, compared with 20,289 in 2021, decreasing 25%. Total sales volume in 2022 was approximately $10.5B compared to $13B in 2021.

“Even with the normal seasonal slowdown, December’s performance was in stark contrast to the very active resale market that opened 2022,” says Ken Dekker, OREB’s newly installed 2023 President. “As interest rates and inflation both climbed, buyers retreated to the sidelines and began taking a wait and see approach. However, while it’s quieter than the frantic pace we experienced in 2021, it is now a balanced market.”

By the Numbers – Average Prices*:

  • The average sale price for a condominium-class property in December was $434,973, an increase of 9% from 2021.

  • The average sale price for a residential-class property was $655,839, decreasing 7% from a year ago.

  • With year-to-date average sale prices at $769,623 for residential units and $453,770 for condominiums, these values represent a 7% increase over 2021 for residential-class properties and an 8% increase for condominium-class properties.


“Although market activity tapered off in later 2022, there was an immense amount of activity in the spring at high prices,” says Dekker. “This will be an important caveat to consider as we begin comparing 2023 numbers to the previous year.”

By the Numbers – Inventory & New Listings:

  • Months of Inventory for the residential-class properties has increased to 3.7 months from 0.9 months in December 2021.

  • Months of Inventory for condominium-class properties has increased to 3.9 months from 0.9 months in December 2021.

  • December’s new listings (699) were 17% higher than 2021 (600) and down 56% from November 2022 (1,598). The 5-year average for new listings in December is 662.


“The leading economic force behind Ottawa’s rapid appreciation in the past five years is chronic supply insufficiency,” says Dekker. “It intensified during the pandemic as prospective purchasers capitalized on incredibly low interest rates. Today’s higher rates are slowing down building projects, which exacerbates the low supply issue.”

“Since Ottawa is made up of hyper-local markets, it is a difficult ecosystem to forecast,” says Dekker. “Plus, there are a multitude of factors influencing a changing economic environment these days that will dictate how much activity the resale market will see in 2023. REALTORS® have access to expert insights and industry resources that can help buyers and sellers navigate the complexities.”

REALTORS® also help with finding rentals and vetting potential tenants. OREB Members have assisted clients with renting 6,105 properties this past year compared to 4,813 in 2021.

(SOURCE: OREB)

Read

Ottawa Real Estate-November Stats and Facts (2022)

Members of the Ottawa Real Estate Board (OREB) sold 846 residential properties in November through the Board’s Multiple Listing Service® (MLS®) System, compared with 1,456 in November 2021, a decrease of 42%. November’s sales included 658 in the residential-property class, down 39% from a year ago, and 188 in the condominium-property category, a decrease of 50% from November 2021. The five-year average for total unit sales in November is 1,270.

“November’s sales were expectedly low given the typical slowdown this time of year but they also reflect today’s economic conditions,” says Penny Torontow, OREB’s 2022 President. “This is not isolated to our local market. Globally, we’re still adjusting to the post-pandemic world and that affects demand, pricing, interest rates, cost of living, supply chain disruptions and more. As a result, those who can, are waiting and watching.”

By the Numbers – Average Prices*:

  • The average sale price for a condominium-class property in November was $415,533, a decrease of 4% from 2021.

  • The average sale price for a residential-class property was $680,031, decreasing 5% from a year ago.

  • With year-to-date average sale prices at $774,422 for residential units and $454,436 for condominiums, these values represent an 8% increase over 2021 for both property classes.


“What’s concerning about the current market is the impact on first-time homebuyers,” says Torontow. “The marked decrease in condo sales, for example, signals that even entry-level properties are being affected. Fluctuating markets, paired with the stress test, are keeping first-time buyers on the sidelines in a tight rental market—with MLS® rentals increasing 27% this year over last.”

By the Numbers – Inventory & New Listings:

  • Months of Inventory for the residential-class properties has increased to 3.5 months from 0.9 months in 2021.

  • Months of Inventory for condominium-class properties has increased to 3.4 months from 1.1 months in 2021.

  • November’s new listings (1,598) were 12% higher than 2021 (1,429) and down 22% from October 2022 (2,046). The 5-year average for new listings in November is 1,398.


“With nearly four months of inventory and an average 30 days on market, Ottawa now has a balanced resale market, slightly tipping toward the buyers,” says Torontow. “Sellers are well-advised to work with a REALTOR® who has hyper-local knowledge about specific neighbourhoods, appropriate price points and ideal timing. Prices are adjusting but real estate is a long-term investment. It’s the same reason I tell buyers to marry the house and date the rate.”

(SOURCE: OREB)

Read

Ottawa Real Estate-October Stats and Facts (2022)

Members of the Ottawa Real Estate Board sold 987 residential properties in October through the Board’s Multiple Listing Service® (MLS®) System, compared with 1,670 in October 2021, a decrease of 41%. October’s sales included 758 in the residential-property class, down 40% from a year ago, and 229 in the condominium-property category, a decrease of 44% from October 2021. The five-year average for total unit sales in October is 1,554.

“After the volatility of the past two pandemic years, which was unsustainable, the market is correcting and adjusting,” says Penny Torontow, Ottawa Real Estate Board President. “The slowdown is compounded by Bank of Canada interest rate increases, which further exacerbates buyer hesitancy and weakens people’s purchasing power—especially first-time homebuyers.”

“Demand is still high, and with increasing inventory available, Buyers have more choices and time to shop for their new home. However, the ongoing speculation about where prices and interest rates are headed shakes consumer confidence and has made some prospective Buyers take a wait-and-see approach.”

“Sellers may be understandably concerned about market fluctuations, which have been more drastic lately,” she adds. “As with any major investment, a longer-term perspective is important. The significant year-over-year gains of the last two years were not sustainable. If you have owned your property for any length of time, your equity has increased significantly and will buffer price corrections. If you buy and sell in the same market, it is all relative.”

By the Numbers – Inventory & New Listings:

  • Months of Inventory for the residential-class properties has increased to 3.3 months from 1 month in 2021.

  • Months of Inventory for condominium-class properties has increased to 3 months from 1.2 months in 2021.

  • October’s new listings (2,047) were 4% higher than 2021 (1,960) and down 14% from September 2022 (2,371). The 5-year average for new listings in October is 1,971.


“Buyers and Sellers need to carefully analyze their own unique circumstances. No one can predict with absolute certainty what will happen next year, but in the highly employed and stable Ottawa market, real estate has been and continues to be a good investment over time,” says Torontow. “They don’t have a crystal ball, but mortgage brokers and REALTORS® have the education, expertise—and most importantly, the data—to help people make an informed decision for their specific situation.”

By the Numbers – Average Prices*:

  • The average sale price for a condominium-class property in October was $445,691, an increase of 9% from 2021.

  • The average sale price for a residential-class property was $677,873, decreasing 5% from a year ago.

  • With year-to-date average sale prices at $780,390 for residential units and $456,470 for condominiums, these values represent an 8% increase over 2021 for residential-class properties and a 9% increase for condominium-class properties.


REALTORS® also help with finding rentals and vetting potential tenants. Since the beginning of the year, OREB Members have assisted clients with renting 5,186 properties compared to 4,012 last year at this time.

(SOURCE: OREB)

Read

Ottawa Real Estate-September Stats and Facts (2022)

Members of the Ottawa Real Estate Board sold 1,080 residential properties in September through the Board’s Multiple Listing Service® System, compared with 1,601 in September 2021, a decrease of 33%. September’s sales included 816 in the residential-property class, down 34% from a year ago, and 264 in the condominium-property category, a decrease of 27% from September 2021. The five-year average for total unit sales in September is 1,586.

“September’s lower sales performance reflects continued hesitancy among Buyers as they watch interest rates rise and consider the speculation surrounding price trends. With rising interest rates, the mortgage stress test has sidelined some potential Buyers, while others are likely scrutinizing their budgets for affordability amidst inflation and cost of living increases,” says Ottawa Real Estate Board President Penny Torontow.

“On the other hand, we have seen an uptick in the number of new listings entering the market, which were not only higher than last month but also last year, and the five-year average. This trend continues to bring the resale market into more balance, which generally means more time for Buyers and Sellers to weigh their options and to adjust according to their needs,” she adds.

By the Numbers – Inventory & New Listings:

  • Months of Inventory for the residential-class properties has increased to 3.1 months from 1.2 months in 2021.

  • Months of Inventory for condominium-class properties has increased to 2.7 months from 1.6 months in 2021.

  • September’s new listings (2,371) were 5% higher than 2021 (2,252) and 13% higher than August 2022 (2,091).


“Prices are stabilizing with slight month-to-month movement, whereas, year over year we are seeing the slow and steady increases that the Ottawa resale market is known for. As every neighbourhood is different, Buyers will want to consult a local REALTOR® who can tap into proprietary data on price trends and expert insights to help them navigate market shifts,” Torontow advises.

By the Numbers – Average Prices*:

  • The average sale price for a condominium-class property in September was $450,987, an increase of 6% from 2021.

  • The average sale price for a residential-class property was $706,658, increasing 0.5% from a year ago.

  • With year-to-date average sale prices at $788,535 for residential and $457,189 for condominiums, these values represent a 9% increase over 2021 for both property classes.


REALTORS® also help with finding rentals and vetting potential tenants. Since the beginning of the year, OREB Members have assisted clients with renting 4,678 properties compared to 3,598 last year at this time.

(SOURCE: OREB)

Read

Ottawa Real Estate-August Stats and Facts (2022)

Members of the Ottawa Real Estate Board sold 1,137 residential properties in August through the Board’s Multiple Listing Service® System, compared with 1,565 in August 2021, a decrease of 27 per cent. August’s sales included 850 in the residential-property class, down 27 per cent from a year ago, and 287 in the condominium-property category, a decrease of 28 per cent from August 2021. The five-year average for total unit sales in August is 1,603.

“August is a traditionally slower month in Ottawa’s resale market ebb and flow cycle due to summer vacations. Compounding the slowdown in market activity, Buyers are uncertain about their purchasing power given impending additional interest rate hikes,” states Ottawa Real Estate Board President Penny Torontow.

“The lightning speed at which homes were selling at the start of 2022 is a thing of the past, evidenced by Days on Market (DOMs) inching closer to that 30-day mark. We have also observed a return to standard financing and inspection conditions and fewer multiple offer scenarios,” she adds.

Additional figures:

  • The average sale price for a condominium-class property in August was $421,966, an increase of 4 per cent from 2021.

  • The average sale price for a residential-class property was $707,712, increasing 5 per cent from a year ago.

  • With year-to-date average sale prices at $795,978 for residential and $457,771 for condominiums, these values represent a 10 per cent and 9 percent increase over 2021, respectively.*

  • 2,093 properties were listed in August, boosting inventory to nearly 3 months for residential class properties and 2.2 months for condominiums.


“Prices are still rising slightly in some areas, albeit lower single-digit percentage increases, bringing back the moderate price-growth stability that is characteristic of the Ottawa resale market. What happened to prices in 2020 and 2021 was unusual. We are moving towards a balanced market state, where Buyers have choices and Sellers need to ensure they are pricing their properties accurately,” Torontow advises.

“The informed market knowledge and insight of a licensed REALTOR® is critical to both Buyers and Sellers navigating market shifts. Sellers will want to closely explore with their REALTOR® the best time and price to list their home to optimize a property’s days on market. Buyers can use the extra time to work with their REALTOR® on due diligence and finding a dream home that meets their needs within their financial parameters.”

REALTORS® also help with finding rentals and vetting potential tenants. Since the beginning of the year, OREB Members have assisted clients with renting 4,172 properties compared to 3,182 last year at this time.

(SOURCE: OREB)

Read
This website may only be used by consumers that have a bona fide interest in the purchase, sale, or lease of real estate of the type being offered via the website. The data relating to real estate on this website comes in part from the MLS® Reciprocity program of the PropTx MLS®. The data is deemed reliable but is not guaranteed to be accurate.