Ottawa Market Remains Balanced as Supply Shapes June Conditions
Ottawa’s housing market remained balanced in June, with activity easing in line with typical early-summer patterns, though trailing slightly behind 2025 activity levels. Supply remains elevated by recent years’ standards, continuing to give buyers more choice.
The impact of the elevated inventory is presenting differently by property type: single-family homes remained comparatively steady, townhomes showed more volatility, and apartment-style properties continue to be the softest segment.
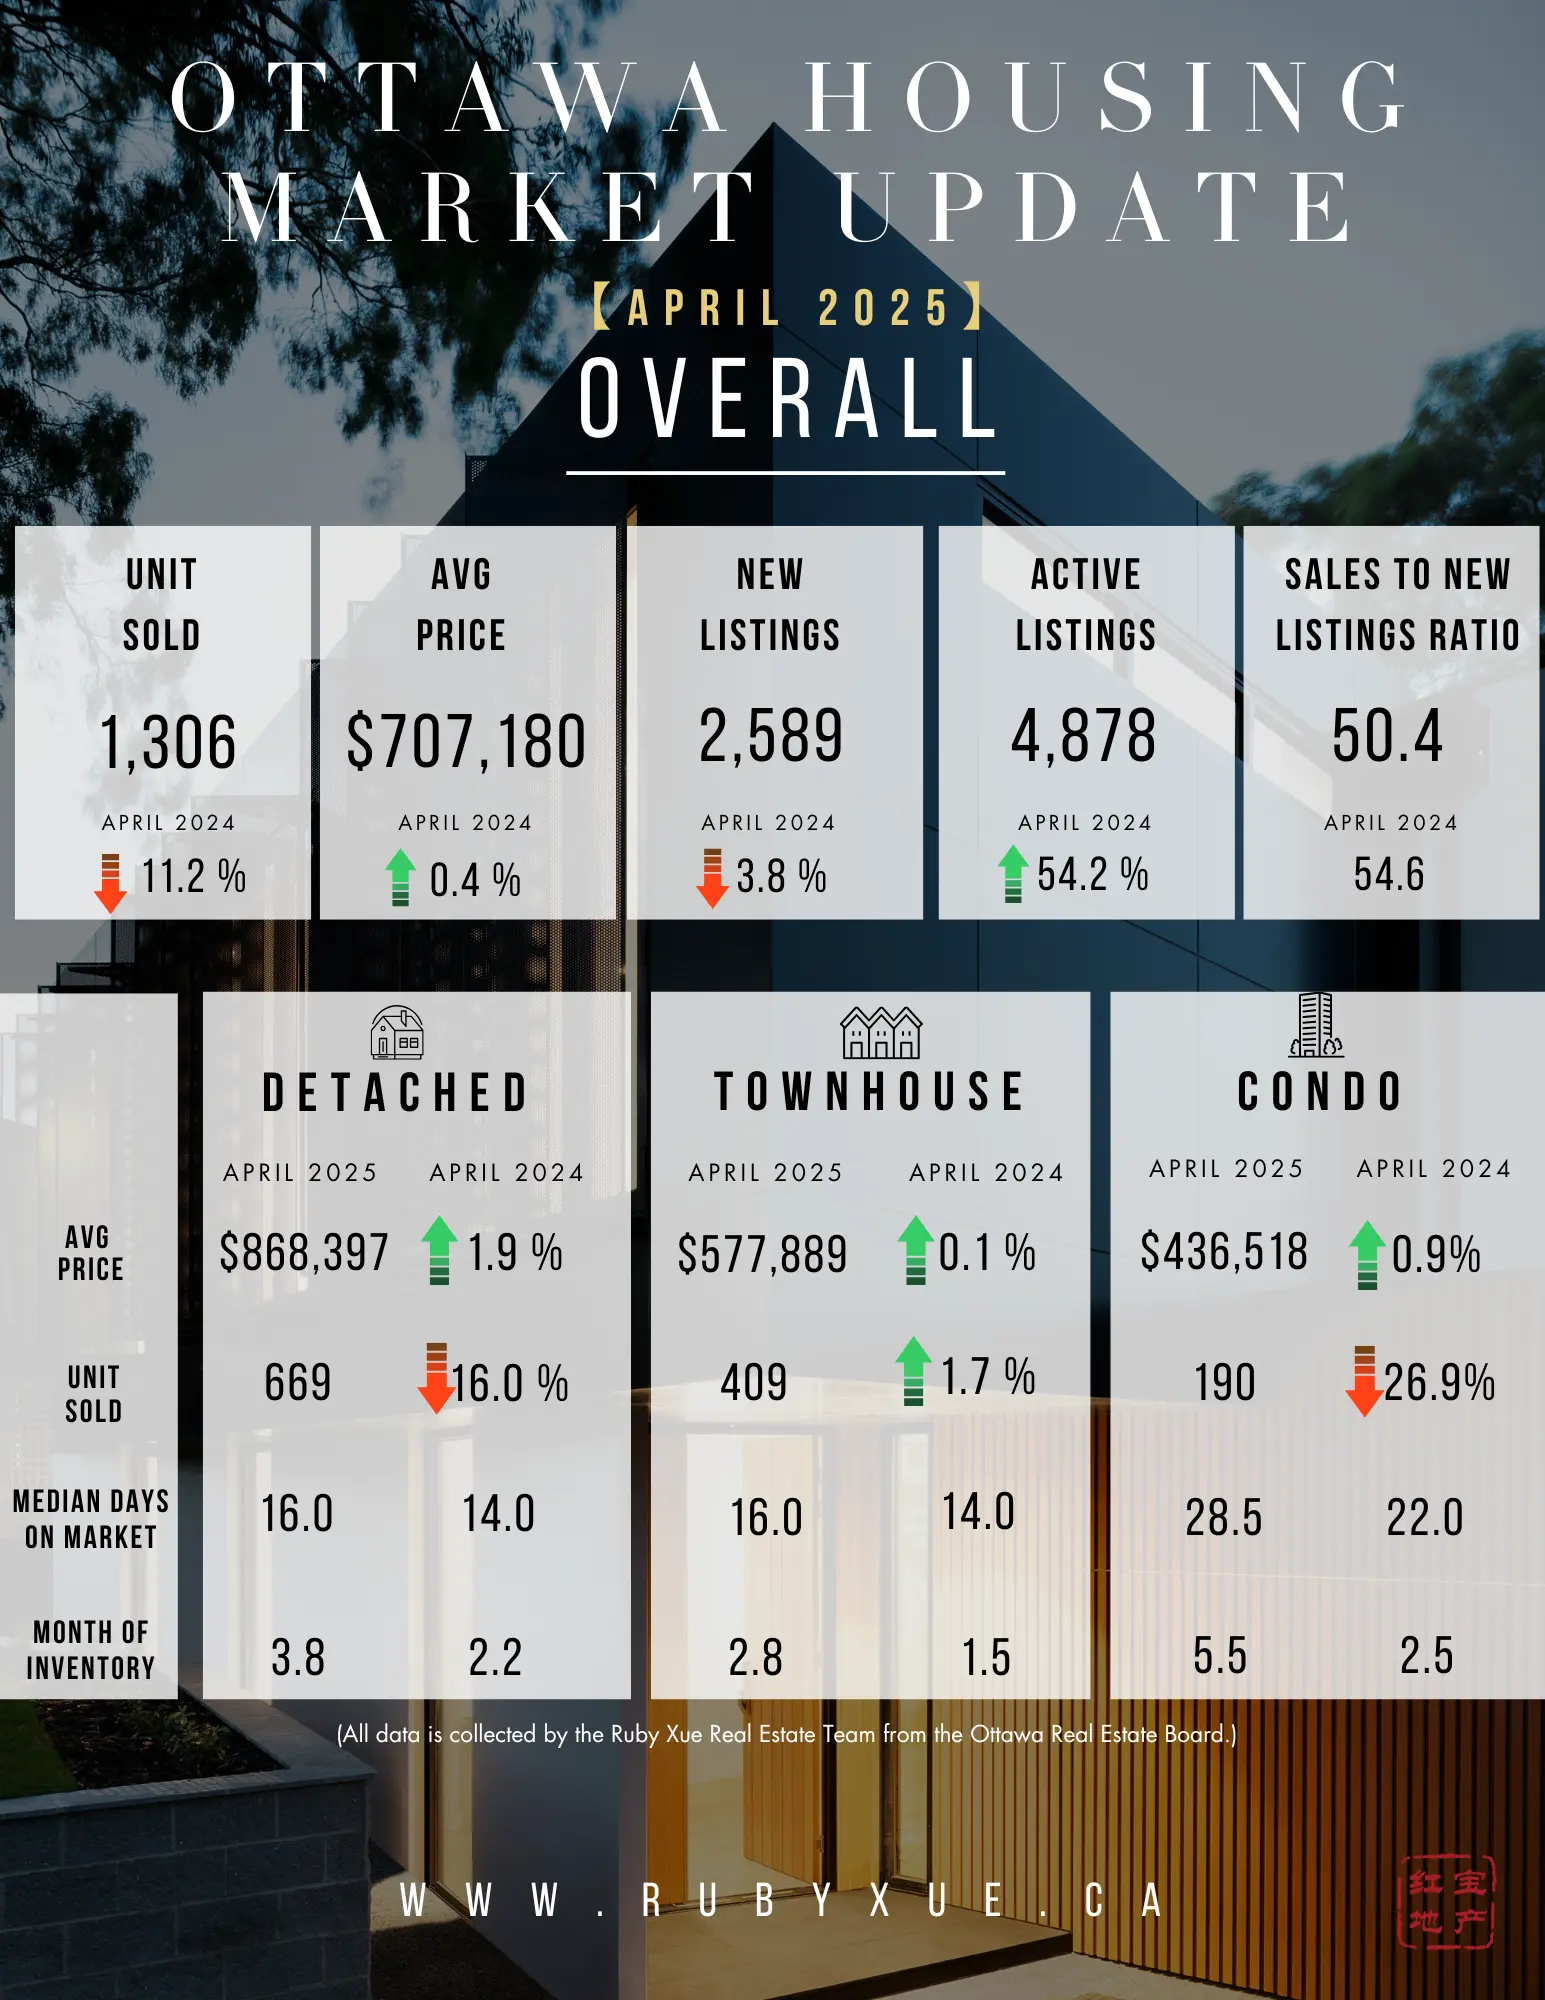
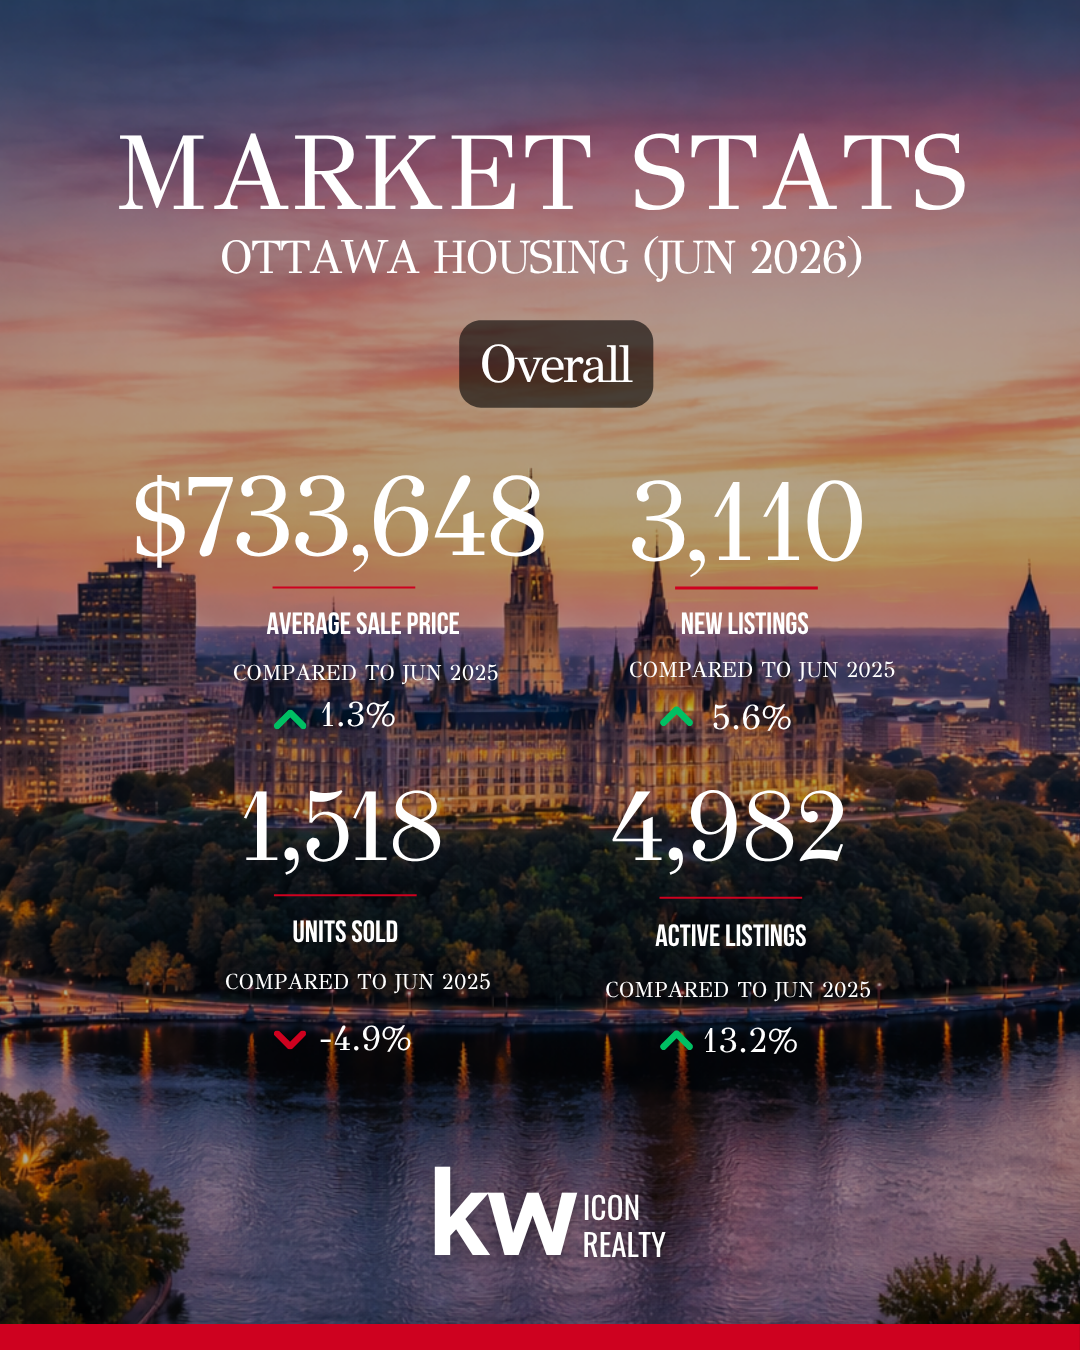
Pricing reflected that mixed picture. The average residential sale price was $733,648 in June, up 1.3% from a year earlier, while the median price was $655,000, down 1.3%.
The market continues to unfold against a cautious economic backdrop, though economic indicators are less gloomy than last month leading to some guarded optimism. The Bank of Canada held its policy rate in June, and Statistics Canada reported that real GDP grew in April after contracting in March. At the same time, uncertainty around North American trade policy continues to weigh on the broader economic outlook.
Overall, June showed a market that remains steady but is more divided beneath the surface. Supply is shaping conditions, but not overwhelming them, and the next phase of the market will depend on how well demand continues to absorb available listings across different property types.
“As we move through the summer market, the key story isn’t simply higher inventory, it’s how well demand continues to absorb that supply,” said OREB President Tami Eades. “Ottawa remains a fundamentally balanced market, but we’re seeing clear differences emerge between property types and neighbourhoods. That’s why buyers and sellers should focus less on citywide headlines and more on local market conditions. Working with a REALTOR® who understands those micro-market dynamics is more valuable than ever.”
Residential Market Activity
In June, 1,518 homes were sold through the MLS® System in Ottawa, a 4.9% decrease compared to June 2025. While sales were lower than May’s 1,616, that decline is consistent with the normal transition from the spring market into the early-summer period.
Sales activity varied by property type. Single-family homes continued to account for the largest share of activity, with 879 sales in June, down 1.8% from a year earlier. Townhouse sales totalled 429, down 7.3%, while apartment-style properties recorded 178 sales, down 14.0%.
This reinforces the property-type divide that has been building through the first half of the year: single-family demand has been steadier, while townhomes and especially apartments have carried more of the market softness.
Year to date, 6,969 homes have sold in Ottawa, down 6.1% from the same period in 2025. Total dollar volume was $4.9 billion, down 6.2% year over year. The year-to-date figures point to a market that remains active, but still below last year’s sales pace as the first half of 2026 comes to a close.
Prices and Market Balance
June’s price story was about how supply is being absorbed across different parts of the market. The average price was higher than a year ago, while the median price and benchmark measures were softer, suggesting that property mix continued to influence the headline numbers.
New listings were up year over year, active listings continued to rise, and the sales-to-new-listings ratio settled at 48.8%. Months of inventory reached 3.3, up from 2.8 last June. These figures remain consistent with balanced-market conditions.
Importantly, the additional supply has not translated into a broad weakening in transaction conditions. The sale-to-list price ratio remained at 98.5%, unchanged from June 2025, while the median days on market rose only modestly from 19 to 22 days. That suggests Ottawa is seeing more pricing discipline, not a complete shift in market conditions.
The property-type split is the clearest market-balance signal. Single-family homes remained the most stable segment, with 2.8 months of inventory and the strongest sale-to-list ratio among the major property types.
Townhomes continued to adjust as listings accumulated, with active inventory up 27.6% from last June and months of inventory rising to 3.2.
Apartment-style properties (condos) remained the softest segment, with 5.3 months of inventory and weaker benchmark pricing than the broader market.
The MLS® Home Price Index, which helps adjust for changes in the mix of homes sold, reinforced this divide. The composite benchmark price was down 1.3% year over year, with single-family down 0.7%, townhomes down 3.9%, and apartments down 6.0%.
Overall, June does not point to a market-wide price correction. It points to a balanced market where elevated supply is creating more pricing pressure, and where the clearest signs of high-supply effects remain concentrated in townhomes and apartment-style properties rather than across Ottawa as a whole.
Regional Market Comparison
Ottawa’s regional data reinforced the broader theme of a balanced but uneven market. The three suburban submarkets continued to account for most of the city’s sales activity, led by Ottawa Suburb South with 382 sales, Ottawa Suburb West with 373, and Ottawa Suburb East with 328. Together, those three areas represented more than 70% of Ottawa’s June sales.
The suburban picture was not uniform. Ottawa Suburb South recorded the highest sales total, but Ottawa Suburb West showed the firmest absorption, with the highest sales-to-new-listings ratio among the seven submarkets and the lowest months of inventory.
Ottawa Suburb East remained active, though sales were lower than last year and new listings were up, pointing to more choice for buyers.
Central and rural markets were more uneven. Ottawa Centre recorded 143 sales and had higher months of inventory than the citywide level, while Ottawa Rural East was the only submarket to post year-over-year sales growth. Rural West and Rural South had smaller transaction totals, which makes monthly movements more variable, but both continued to show more supply-sensitive conditions.
Overall, the regional data points to a market shaped by local differences rather than one broad trend. Suburban areas continue to drive most activity, but absorption, supply, and pricing conditions vary meaningfully by area.
Looking Ahead
As Ottawa moves through the summer market, the most useful signals will come less from any single month of sales and more from whether demand continues to absorb elevated supply at a steady pace. REALTORS® should be watching the sales-to-new-listings ratio, months of inventory by property type, median days on market, and whether price trends continue to diverge between single-family, townhouse, and apartment-style properties.
CMHC’s latest data adds important context to the supply story. Ottawa had 17,212 housing units under construction in May,with nearly 14,000 of those apartment units. Combined with national demographic data pointing to slower population growth and fewer non-permanent residents, there remains the possibility of an influx of apartment-style units into the market in a way that could significantly impact market conditions.
While this does not point to an immediate oversupply issue as completed and unabsorbed apartment inventory remains low with 37 apartment units reported in May; it does suggest future pressure will depend less on construction activity itself and more on whether demand continues to keep pace as projects are completed.
The rental side should also be monitored carefully. CMHC reported a 3.0% primary rental vacancy rate in Ottawa in 2025, while the condominium rental vacancy rate was much tighter at 0.6%. That means the apartment outlook is not simply a story of excess supply. It is a question of how resale demand, rental demand, investor activity, and new apartment completions interact over time.
REALTORS® in Ottawa, as always, would do well to thoroughly understand the micro-market they are operating in for their clients.
(SOURCE: OREB)