The Glebe, Dow's Lake, Old Ottawa East, and their surrounding communities form one of Ottawa's most desirable and diverse residential corridors — anchored by the Rideau Canal, Lansdowne Park, and some of the city's finest heritage architecture. Average prices in the Glebe proper run approximately $1.57 million, but the broader area offers meaningful variation: buyers who cannot reach the Glebe's price point will find adjacent communities with their own strong character and better value. Here is a breakdown of the four key sub-areas to consider.
What Are the Main Sub-Areas in the Glebe Corridor?
The "Glebe area" as buyers commonly consider it spans four distinct communities, each with its own feel, price range, and buyer profile. Understanding the differences is essential before committing to any specific address.
The Glebe Proper: The Canal Core, Bank Street, and Heritage Victorian Ottawa
What Is the Glebe Proper?
The Glebe proper runs roughly from the Queensway (417) in the north to the Rideau Canal in the west, Bank Street as the main north-south spine, and Bronson Avenue to the east. It is the original Glebe — the neighbourhood of Victorian and Edwardian brick homes, tree-lined residential streets, and the Bank Street commercial corridor that gives the neighbourhood its character.
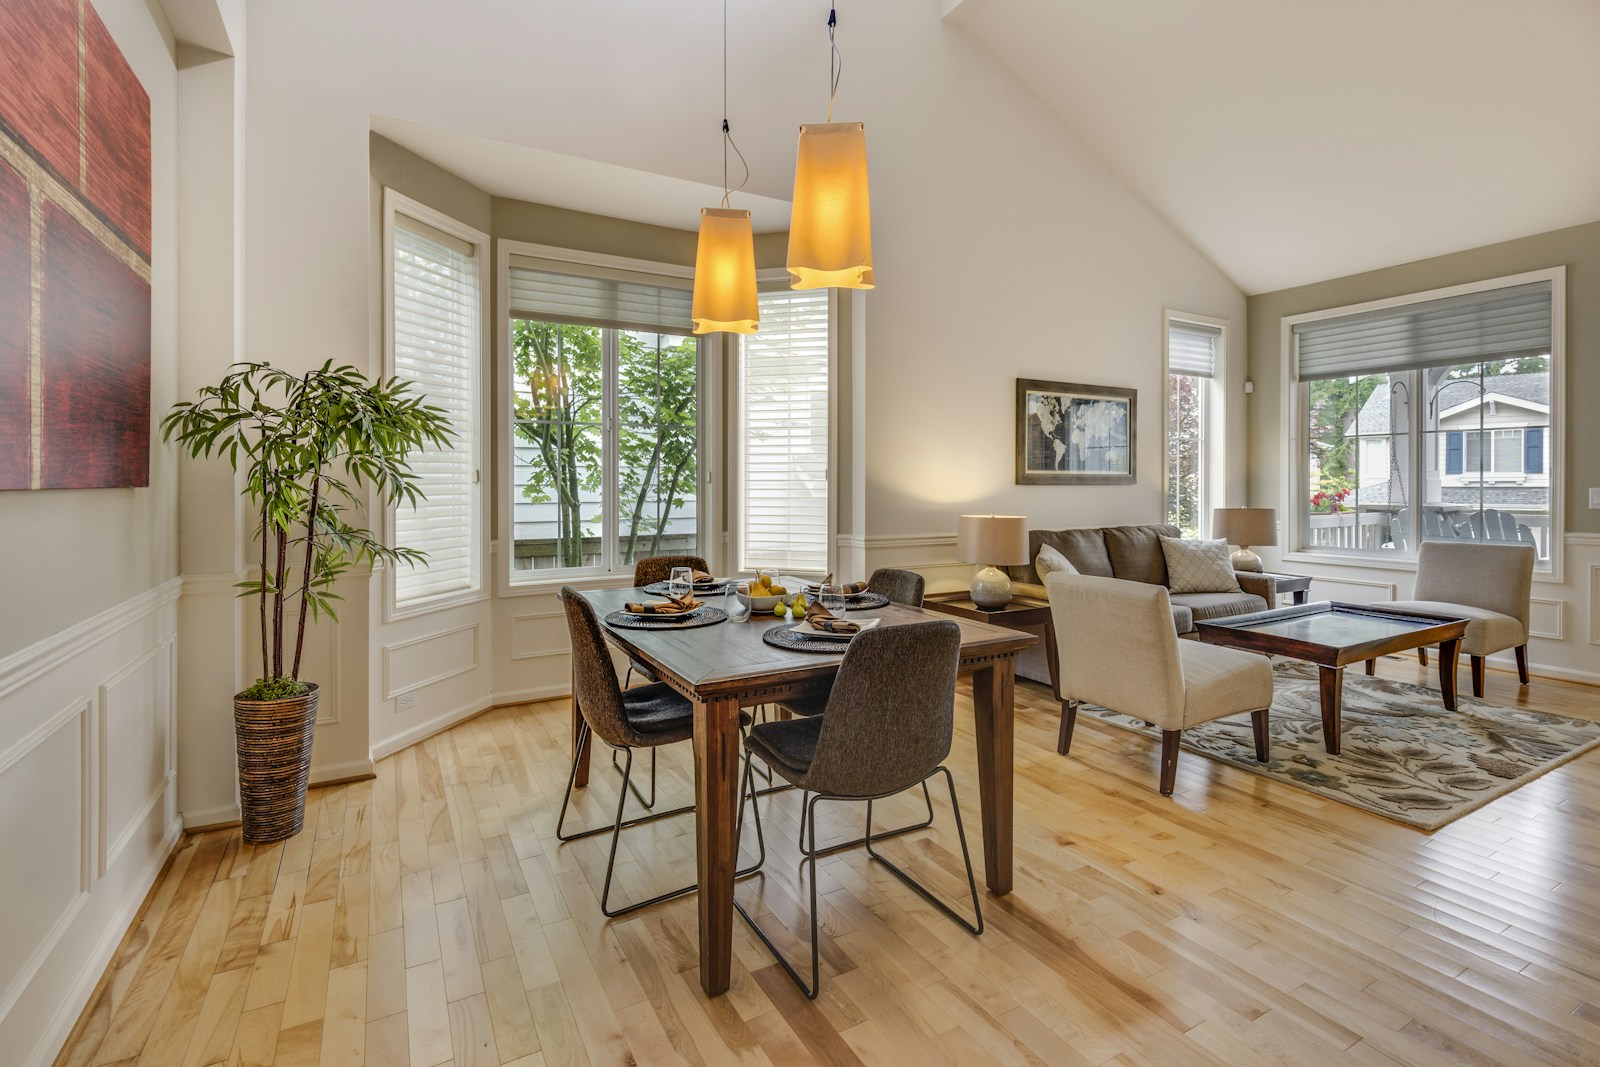
This is where the $1.57M average lives. Heritage detached homes — three and four bedrooms, often with original woodwork, fireplaces, and high ceilings alongside modern kitchen and bathroom renovations — make up the majority of available housing. Canal-adjacent streets like Fifth Avenue and Linden Terrace carry the highest premiums, often trading above $2M for well-positioned detached properties.
Who Is the Glebe Proper Best For?
The Glebe proper rewards buyers who are purchasing for the long term and who can absorb the premium without overextending. It is Ottawa's most consistent capital-preservation neighbourhood — properties here do not get cheaper over time, and the heritage character and Canal proximity create permanent scarcity that supports value through market cycles.
Best for: Established professional couples and families, move-up buyers with significant equity from a previous sale, buyers specifically seeking heritage character and Canal access.
Price context: Entry around $950,000–$1.2M for smaller properties; detached heritage homes $1.4M–$2.5M+.
Dow's Lake: Canal Views, Quieter Streets, and a Residential Pace
What Is Dow's Lake?
Dow's Lake is the Glebe's quieter western neighbour — a smaller, primarily residential community centred around the lake that the Rideau Canal widens into at the south end of the Ottawa Experimental Farm. The Dows Lake Pavilion sits on the water's edge, offering a restaurant, canoe and paddleboat rentals, and one of Ottawa's most beautiful outdoor skating surfaces in winter.
The neighbourhood has a slightly more relaxed pace than the Glebe proper. It is further from Bank Street's retail concentration but closer to the NCC's experimental farm pathways and cycling routes. Housing here is a mix of older detached homes, mid-century bungalows, and some smaller infill development.
Who Is Dow's Lake Best For?
Dow's Lake attracts buyers who want the Canal lifestyle with fewer people, less traffic, and a quieter residential tone than the Glebe's Bank Street side delivers. It is also frequently favoured by buyers who prioritize cycling — the NCC pathways connecting Dow's Lake to the Arboretum, Carleton University, and westward along the Canal are some of Ottawa's most scenically excellent.
Best for: Couples and families who prioritize nature access over retail proximity, buyers who want the Canal lifestyle at slightly less intensity than the Glebe core, cycling-focused buyers.
Price context: Generally aligned with or slightly below the Glebe proper average, depending on specific street and proximity to the lake; expect $900,000–$1.6M for detached homes.
Old Ottawa East: East of the Canal, More Affordable, and Actively Transitional
What Is Old Ottawa East?
Old Ottawa East (OOE) sits on the east side of the Rideau Canal, connected to the Glebe by the Cummings Bridge and Pretoria Bridge crossings. It is one of Ottawa's most actively transitional established neighbourhoods — a mix of heritage homes on residential streets, a significant urban intensification project at Oblate Lands along the Canal, and a cycling and pedestrian culture that rivals any neighbourhood in the city.
The Main Street strip in Old Ottawa East has developed meaningfully in recent years, adding independent coffee shops, restaurants, and local retail that have raised the neighbourhood's liveability profile. The Farmboy grocery store on Main Street anchors daily shopping for many OOE residents.
Who Is Old Ottawa East Best For?
OOE is the Glebe-adjacent alternative for buyers who want Canal proximity and heritage neighbourhood character but cannot reach the Glebe proper's $1.57M average. Properties here — detached and semi-detached homes, townhouses, and a growing supply of new condos from the Greystone Village development along the Canal — offer genuine Ottawa East character at prices that meaningfully undercut the Glebe.
For cyclists and pedestrians, OOE is exceptional. The Cummings and Pretoria Bridges connect it to the Canal pathway directly, and the Rideau River pathway runs along the neighbourhood's eastern edge. OOE buyers who commute by bike are positioned for one of Ottawa's best cycling-to-work experiences.
Best for: Value-oriented Glebe buyers, buyers who want a transitional neighbourhood with clear upward trajectory, cyclists and pedestrians, buyers looking at the new Greystone Village condo supply.
Price context: Detached homes $750,000–$1.3M; Greystone Village condos $500,000–$900,000; generally $300,000–$600,000 below comparable Glebe proper properties.
Heron Park and Carleton Heights: The Value Alternative for Glebe-Minded Buyers
What Is Heron Park / Carleton Heights?
Heron Park and Carleton Heights sit south of the Glebe, between Heron Road and Riverside Drive, adjacent to Carleton University. They are not typically considered part of the Glebe itself, but they function as the value-oriented alternative for buyers who are priced out of the Glebe proper and want an established, low-density residential neighbourhood with reasonable proximity to the Glebe's amenities.
The housing stock in these areas is predominantly mid-century detached homes — 1950s and 1960s bungalows and two-storeys — with larger lot sizes than you typically find in the Glebe. These are functional, liveable homes that have attracted buyers seeking upgrade value: original homes with room for renovation, larger lots at lower per-square-foot prices.
Who Is Heron Park / Carleton Heights Best For?
Buyers who need the space and lot size that the Glebe cannot provide at their budget. A family that requires four bedrooms, a two-car garage, and a functional backyard at a price under $900,000 will find more options in Heron Park and Carleton Heights than anywhere in the Glebe proper. The trade-off is distance from the Canal, Bank Street, and Lansdowne — these are real costs to the lifestyle calculation.
Carleton University's proximity makes this area appealing to academics, researchers, and university staff, as well as investors targeting student-adjacent rental properties.
Best for: Budget-conscious Glebe-area buyers who prioritize space over Canal proximity, families who need more bedrooms and lot size than the Glebe delivers at their budget, university-adjacent investors and buyers.
Price context: Detached homes $650,000–$950,000; meaningfully below Glebe proper pricing for comparable or larger square footage.
Summary: Which Glebe-Area Neighbourhood Is Right for You?
The Glebe area rewards buyers who do their research at the sub-neighbourhood level. A well-connected REALTOR® with established relationships in this corridor is essential — particularly given how frequently Glebe proper properties trade off-market before they appear on public listings.
Ready to Buy or Sell in the Glebe?
The Glebe's market moves fast and off-market deals are common. Ruby Xue of Keller Williams ICON Realty has the local relationships and neighbourhood depth to help you find — or sell — a Glebe property before it hits the public market.
Call Ruby Xue: 613-276-7777 Email: ruby@rubyxue.com | Website: rubyxue.com