RSS

OTTAWA REAL ESTATE - NOVEMBER STATS (2024)

Ottawa’s MLS® Market Making Headway

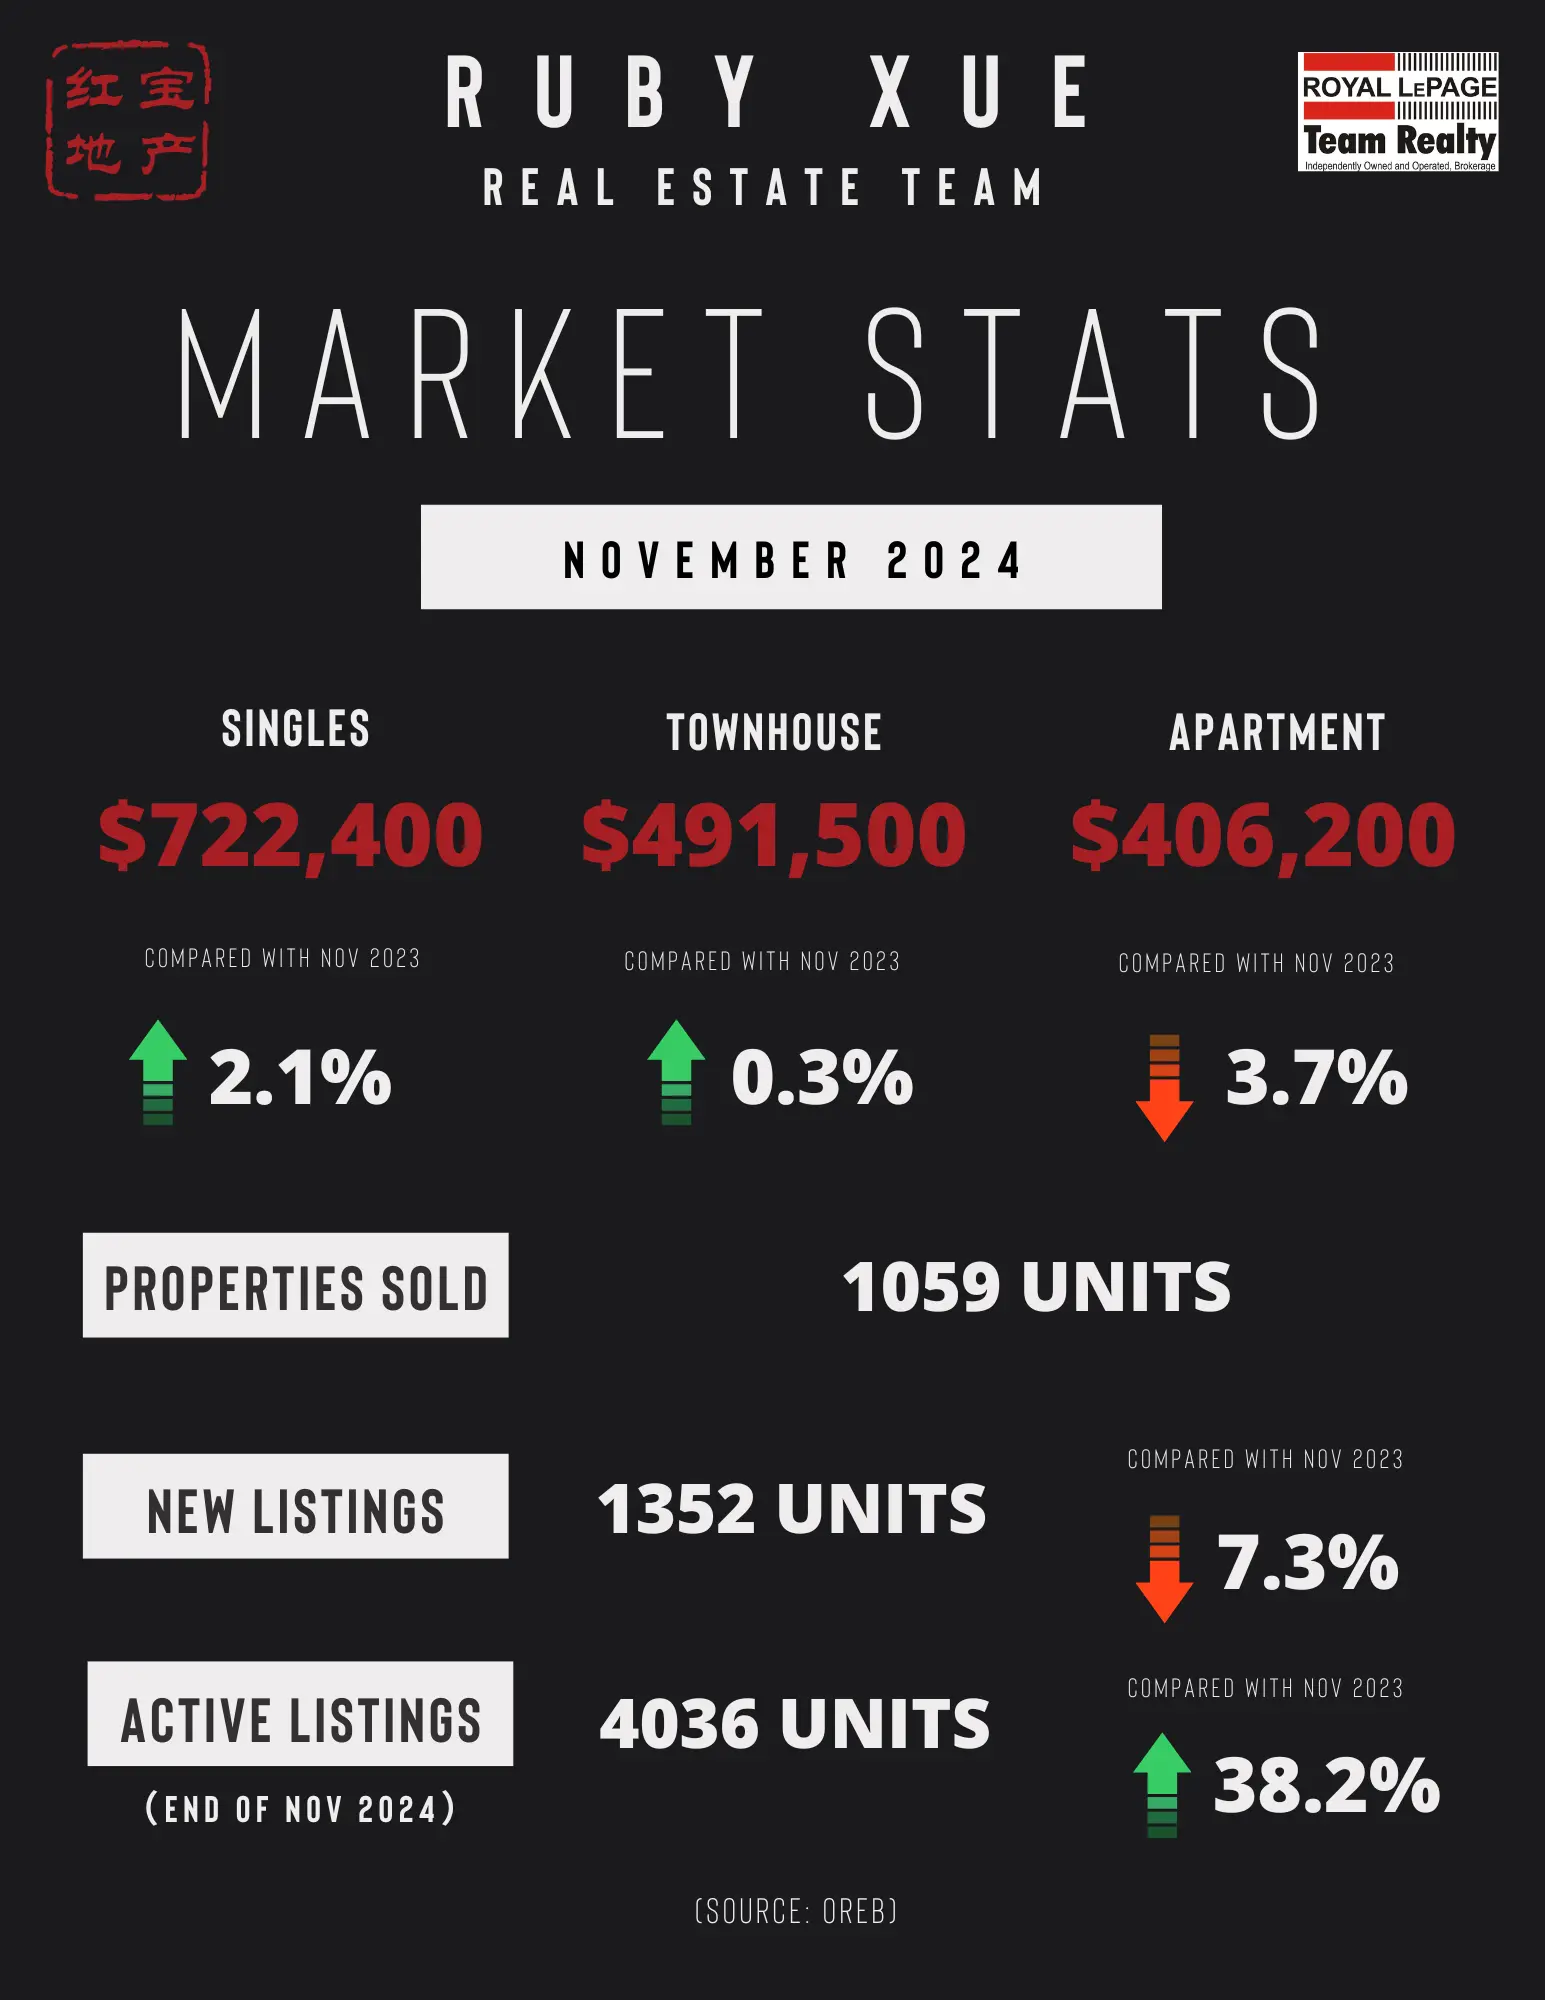
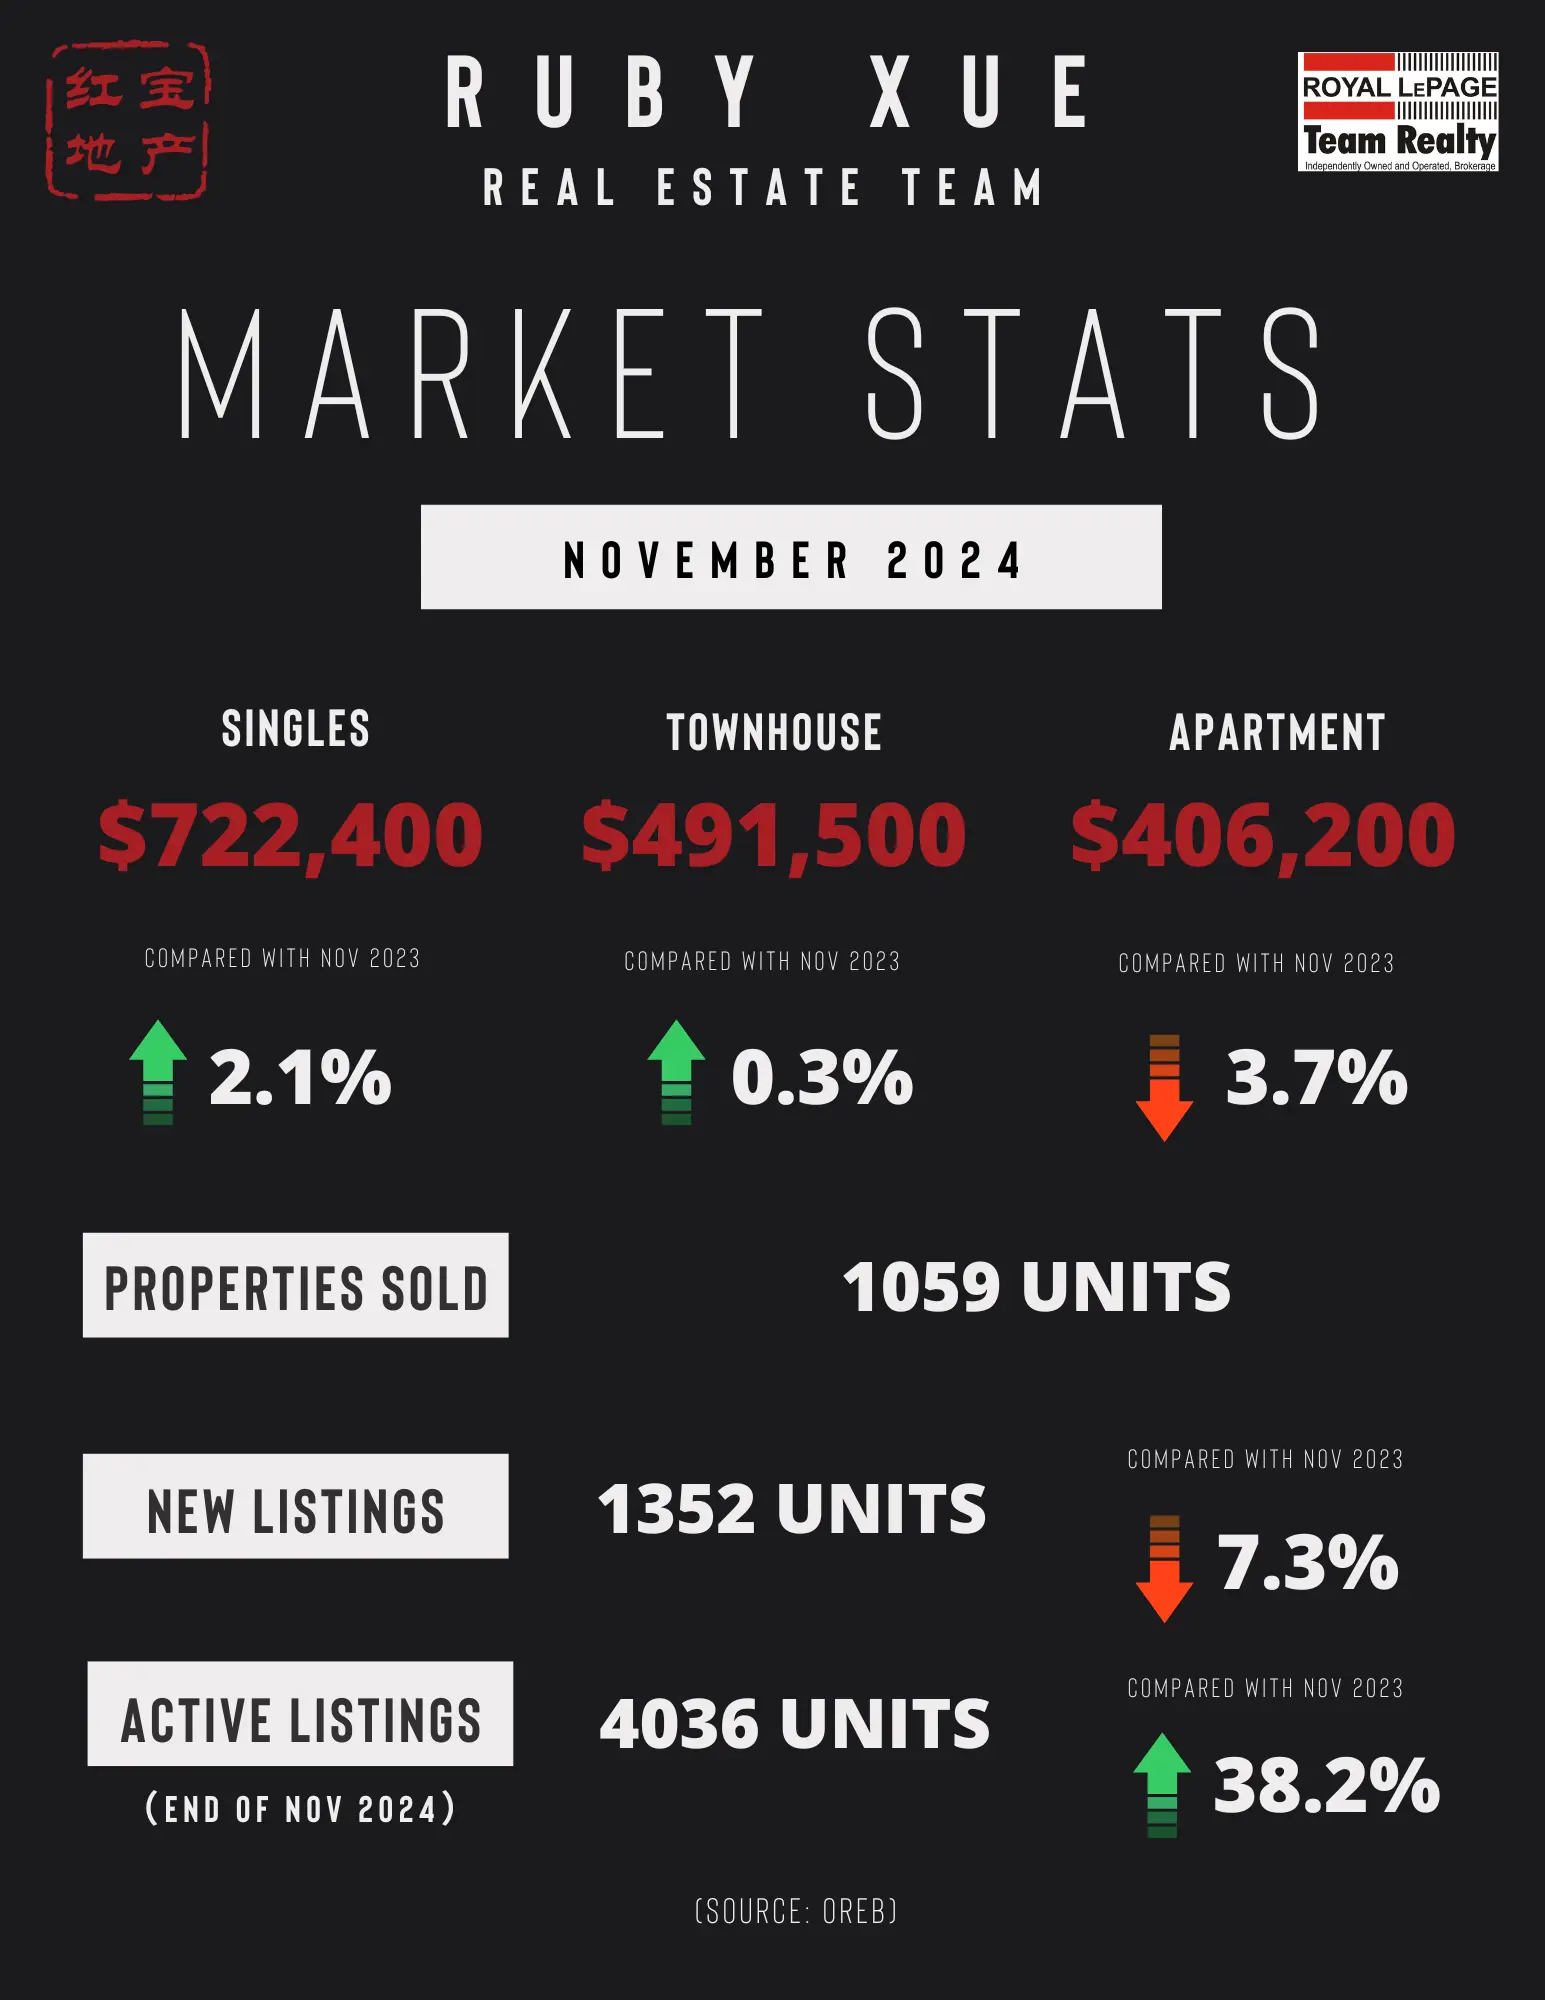
The number of homes sold through the MLS® System of the Ottawa Real Estate Board (OREB) totaled 1,059 units in November 2024 — a slight dip down from the 1,179 units sold the month previous. 

Home sales were 3.1% below the five-year average and 0.5% below the 10-year average for the month of November. 

On a year-to-date basis, home sales totaled 12,882 units in November 2024 — an increase of 11.8% from the same period in 2023.  

“Ottawa’s market is making headway on a long road back from the slowdown experienced in 2023,” says OREB Past-President Curtis Fillier. “Buyers have been slow to come back to the market while watching the interest rates lower, and some are waiting to see how new mortgage rules — the extended amortization period and the increased default insurance cap — coming into effect in December may redefine their purchasing power. Sellers have noticed that caution and those who can are likely holding on for a more active spring.” 

“There will be the typical slowdown at this time of the year as people’s attentions turn to the holidays, and the snow starts to cover a property’s selling features,” says Fillier. “With prices holding steady and open houses getting traffic, though, people are keeping a close eye on opportunities.”  

By the Numbers – Prices: 

  • The MLS® Home Price Index (HPI) tracks price trends far more accurately than is possible using average or median price measures. 

    • The overall MLS® HPI composite benchmark price was $636,700 in November 2024, an increase of 1.5% from November 2023.

      • The benchmark price for single-family homes was $722,400, up 2.1% on a year-over-year basis in November.

      • By comparison, the benchmark price for a townhouse/row unit was $491,500, up 0.3% compared to a year earlier.

      • The benchmark apartment price was $406,200, down 3.7% from last year.

    • The average price of homes sold in November 2024 was $667,098 increasing 4.6% from November 2023.

    • The more comprehensive year-to-date average price was $679,797, increasing by 1.2% from November 2023.

    • The dollar volume of all home sales in November 2024 was $706.4 million, up 51.8% from November 2023.

    OREB cautions that the average sale price can be useful in establishing trends over time but should not be used as an indicator that specific properties have increased or decreased in value. The calculation of the average sale price is based on the total dollar volume of all properties sold. Prices will vary from neighbourhood to neighbourhood.  

    By the Numbers – Inventory & New Listings 

  • The number of new listings saw a decrease of 7.3% from November 2023. There were 1,352 new residential listings in November 2024. New listings were 6.3% below the five-year average and 0.3% above the 10-year average for the month of November.

  • Active residential listings numbered 4,036 units on the market at the end of November 2024, a gain of 38.2% from November 2023. Active listings were 72.8% above the five-year average and 44.3% above the 10-year average for the month of November.

  • Months of inventory numbered 3.8 at the end of November 2024, compared to 4.0 in November 2023. The number of months of inventory is the number of months it would take to sell current inventories at the current rate of sales activity.

    (SOURCE: OREB)

Read

渥太华房价【红宝地产】2024.11月房市数据报告

渥太华MLS®市场取得进展

根据渥太华房地产委员会(OREB)的MLS®系统数据,2024年11月通过MLS®系统售出的房屋总数为1,059套,相较于前一个月售出的1,179套略有下降。

11月的房屋销售量比五年平均水平低3.1%,比十年平均水平低0.5%。

截至2024年11月,全年累计房屋销售量达到12,882套,比2023年同期增长11.8%。

“渥太华的市场正在从2023年的放缓中逐步复苏,”OREB前任主席Curtis Fillier表示。“随着买家观察利率逐步下降,部分人还在等待即将于12月生效的新按揭规则(延长的摊还期和提高的违约保险额度)对其购买力的影响。一些卖家注意到了这种观望情绪,若条件允许,他们可能会选择等待春季更活跃的市场。”

“年末通常会出现季节性市场放缓,因为人们的注意力转向节日,而积雪也掩盖了房产的部分卖点,”Fillier补充道。“不过,由于价格保持稳定且开放看房的人流量持续,市场机会仍然受到密切关注。”

数据解读 - 房价:

MLS®房价指数(HPI)比平均或中位数房价更准确地追踪价格趋势。

  • 2024年11月,整体MLS® HPI综合基准价格为636,700加元,同比上涨1.5%。

  • 单户住宅基准价格为722,400加元,同比增长2.1%。

  • 联排/排屋基准价格为491,500加元,同比上涨0.3%。

  • 公寓基准价格为406,200加元,同比下降3.7%。

  • 2024年11月售出的房屋平均价格为667,098加元,同比上涨4.6%。

  • 更全面的年初至今平均价格为679,797加元,同比上涨1.2%。

  • 2024年11月的总销售额为7.064亿加元,比2023年11月增长51.8%。

OREB提醒,平均售价可以用来观察长期趋势,但不应作为具体房产增值或贬值的直接指标。平均售价的计算基于所有售出房产的总销售额,而价格会因不同社区而异。

数据解读 - 库存与新增房源:

  • 新增房源数量较2023年11月减少7.3%,2024年11月新增住宅房源为1,352套。新增房源比五年平均水平低6.3%,但比十年平均水平高0.3%。

  • 截至2024年11月底,活跃住宅房源数量为4,036套,比2023年11月增长38.2%。活跃房源比五年平均水平高72.8%,比十年平均水平高44.3%。

  • 2024年11月底的库存月数为3.8个月,而2023年11月为4.0个月。库存月数表示以当前销售速度售完现有库存所需的时间。

(数据来源:渥太华地产局OREB)

Read

OTTAWA REAL ESTATE - OCTOBER STATS (2024)

Consumer Confidence Cautiously on the Rise in Ottawa Resale Market

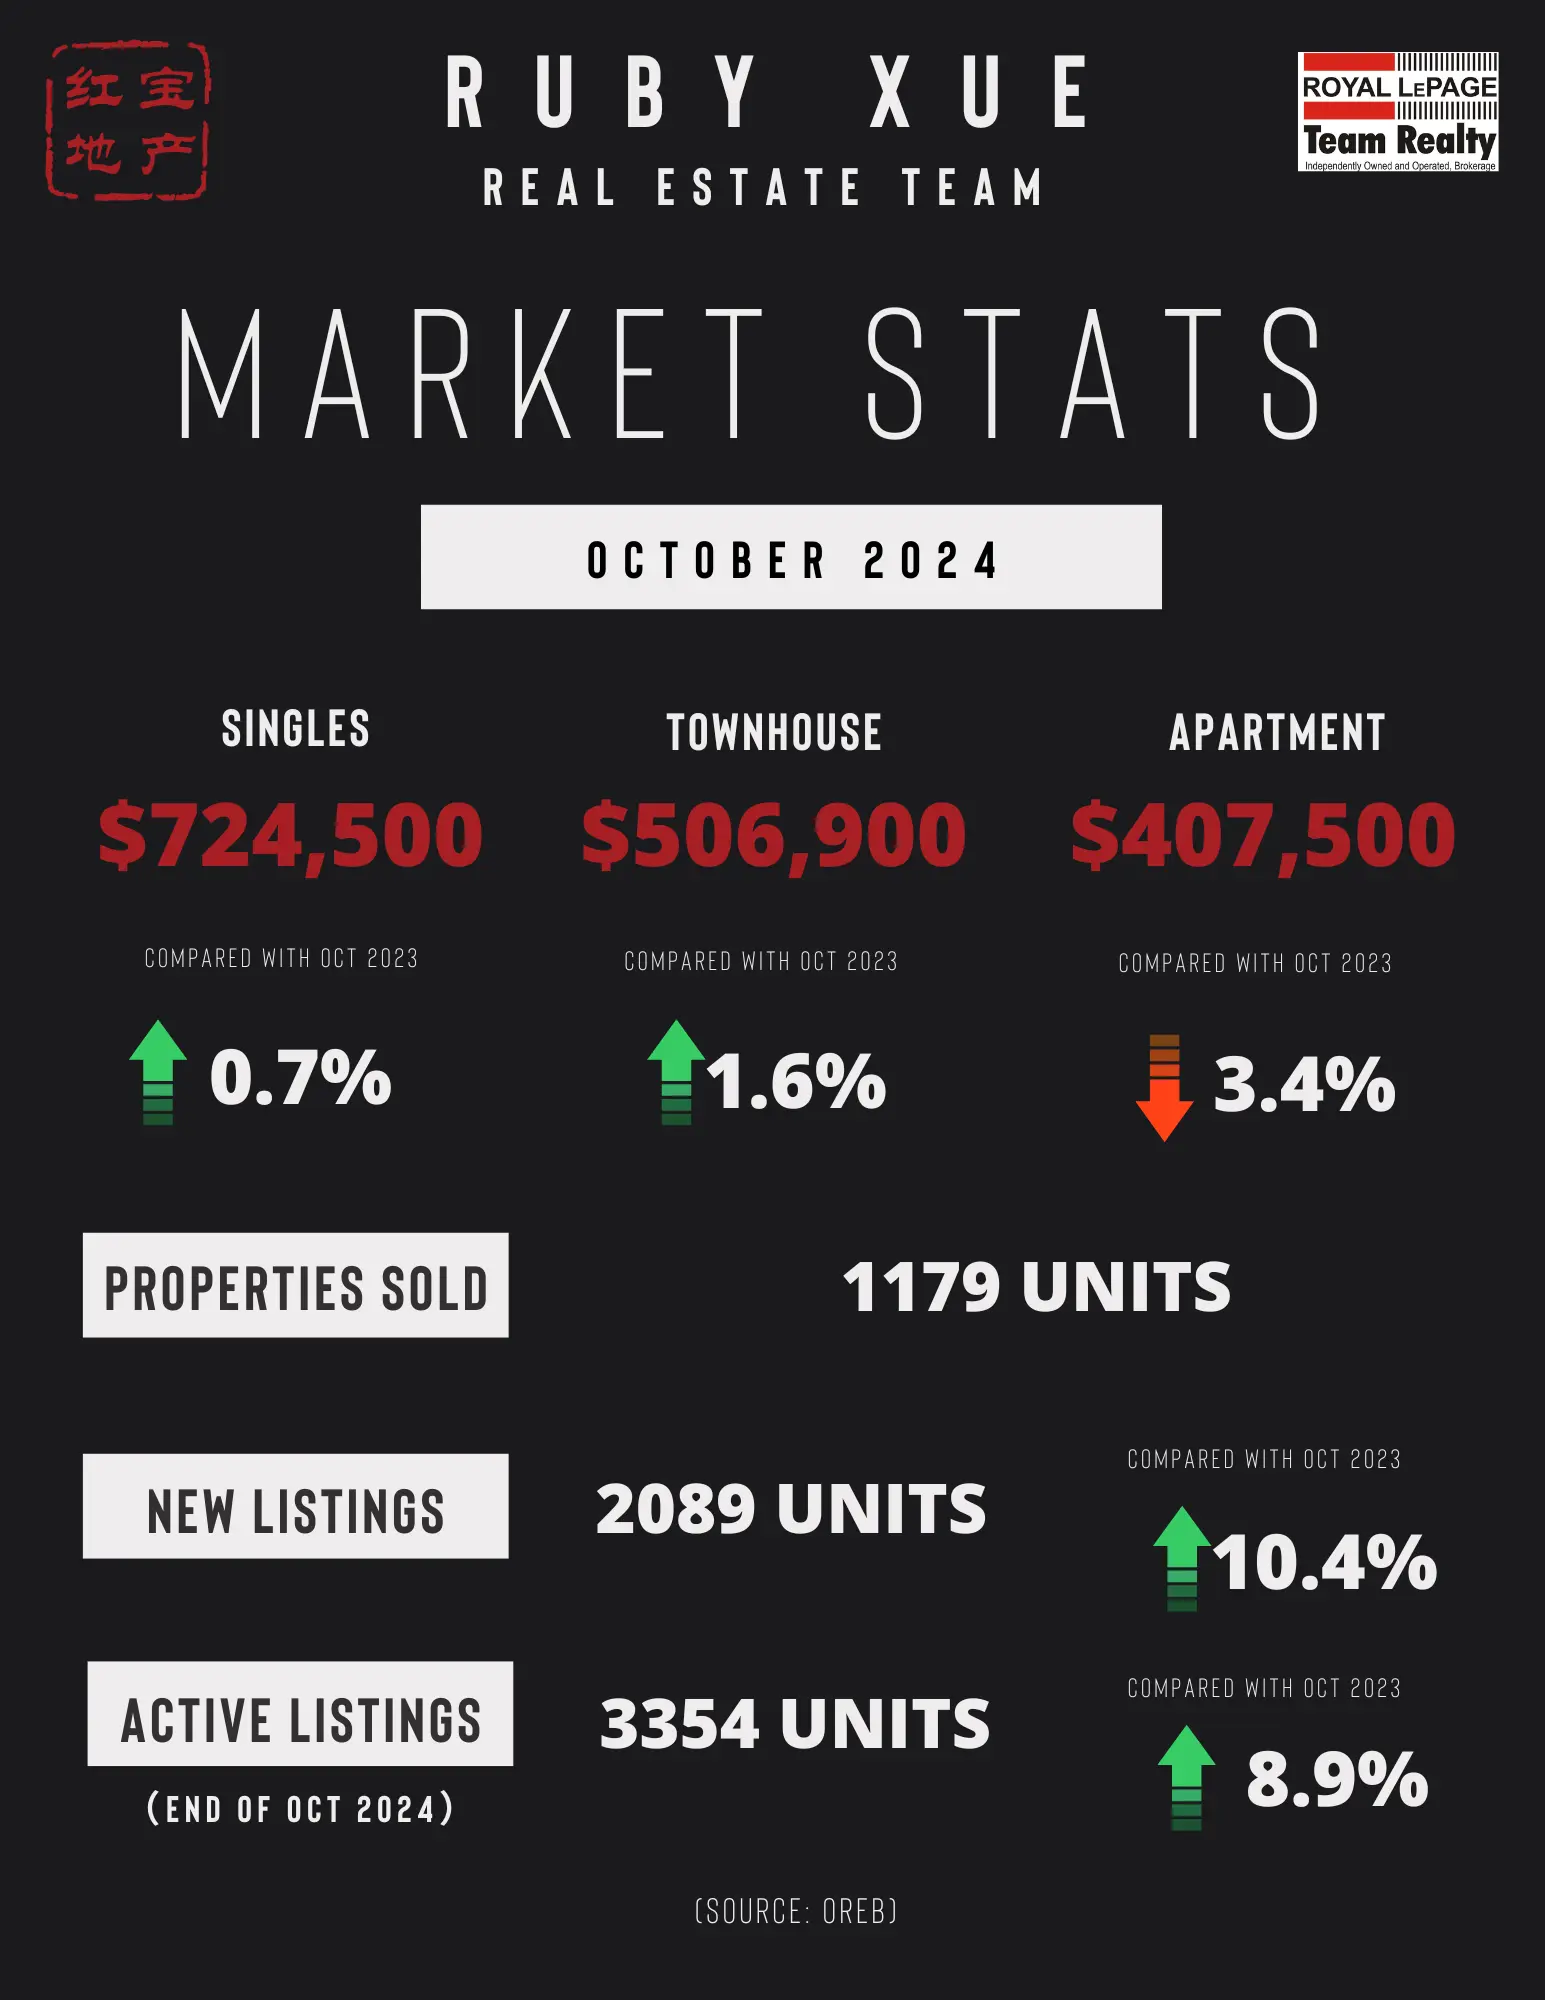
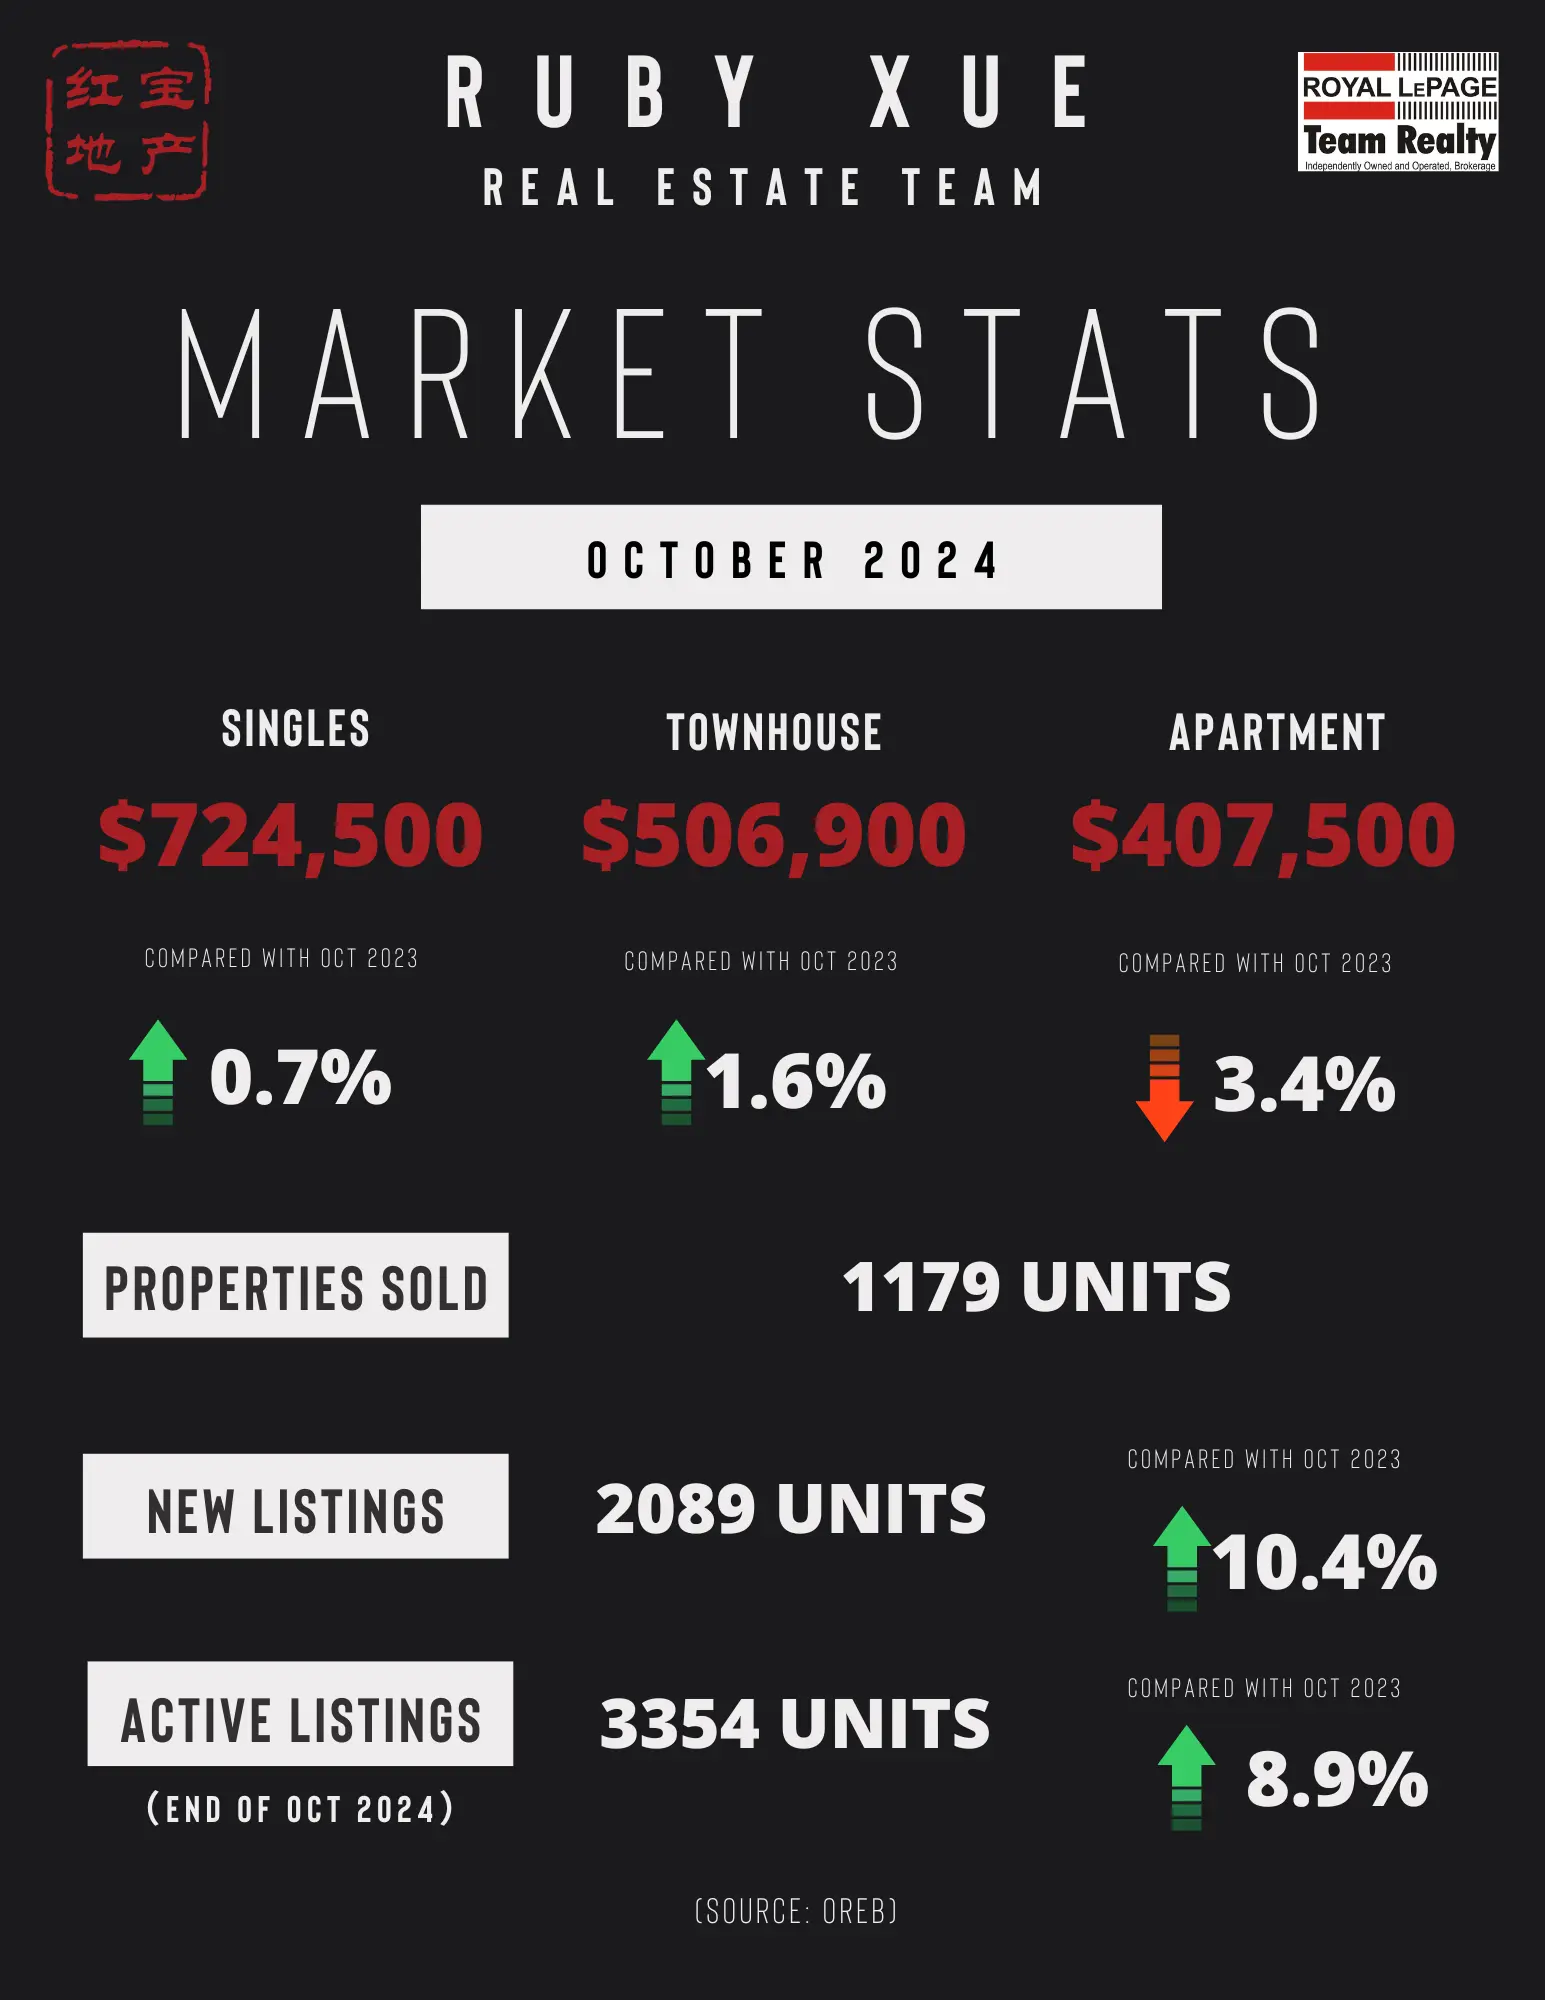
The number of homes sold through the MLS® System of the Ottawa Real Estate Board (OREB) totaled 1,179 units in October 2024 — an increase over the 1,047 units sold last month.

Home sales were 3.9% below the five-year average and 0.9% below the 10-year average for the month of October.

On a year-to-date basis, home sales totaled 11,662 units in October 2024 — an increase of 9.4% from the same period in 2023.

“We’re seeing positive movement in Ottawa’s market with sales activity up,” says OREB President Curtis Fillier. “This is especially interesting because there has been sustained activity throughout the year instead of the typical seasonal spikes and lulls. Consumer confidence is getting stronger, boosted by another consecutive Bank of Canada interest rate cut — though many are waiting for additional rate drops.”

The 50-basis-point reduction might offer optimism following Ontario’s tabling of the Fall Economic Statement where housing starts projections were scaled back to 81,300, representing another reduction in projections and is even further from the province’s goal of creating 125,000 new homes in 2024. The Ontario government cites high interest rates and a tough economic environment as pervasive challenges for homebuilders.

“The challenge remains supply,” says Fillier. “We know from experience that Ottawa’s inventory leans tight and can swing quickly from balanced territory to a seller’s market — which can compound affordability and accessibility challenges. Now is always the time for fresh action and innovative policies that can create much-needed inventory.”

OREB leaders and volunteers recently joined the Canadian Real Estate Association on Parliament Hill to present focused solutions to confront the ongoing housing supply crisis. With expertise and experience in market conditions and consumer needs, REALTORS® advocated to stimulate supply by investing in offsite construction technologies (i.e. prefabricated homes) and extending HST/GST relief for non-profit-built affordable ownership housing.

By the Numbers – Prices: 

The MLS® Home Price Index (HPI) tracks price trends far more accurately than is possible using average or median price measures. 

  • The overall MLS® HPI composite benchmark price was $639,500 in October 2024, an increase of 0.4% from October 2023.

  • The overall MLS® HPI composite benchmark price was $639,500 in October 2024, an increase of 0.4% from October 2023.

    • The benchmark price for single-family homes was $724,500, up 0.7% on a year-over-year basis in October.

    • By comparison, the benchmark price for a townhouse/row unit was $506,900, up 1.6% compared to a year earlier. 

    • The benchmark apartment price was $407,500, down 3.4% from last year.

  • The average price of homes sold in October 2024 was $668,690 increasing 1.2% from October 2023. The more comprehensive year-to-date average price was $678,081, increasing by 0.9% from October 2023.  

  • The dollar volume of all home sales in October 2024 was $788.3 million, up 47.7% from October 2023.

OREB cautions that the average sale price can be useful in establishing trends over time but should not be used as an indicator that specific properties have increased or decreased in value. The calculation of the average sale price is based on the total dollar volume of all properties sold. Prices will vary from neighbourhood to neighbourhood.  

By the Numbers – Inventory & New Listings 

  • The number of new listings saw an increase of 10.4% from October 2023. There were 2,089 new residential listings in October 2024. New listings were 6.7% above the five-year average and 17% above the 10-year average for the month of October.

  • Active residential listings numbered 3,354 units on the market at the end of October 2024, a gain of 8.9% from October 2023. Active listings were 40.6% above the five-year average and 6.7% above the 10-year average for the month of October.

  • Months of inventory numbered 2.8 at the end of October 2024, compared to 3.8 in October 2023. The number of months of inventory is the number of months it would take to sell current inventories at the current rate of sales activity.

    (SOURCE: OREB)

Read

渥太华房价【红宝地产】2024.10月房市数据报告

消费者信心在渥太华转售市场中谨慎回升

2024年10月,通过渥太华房地产委员会(OREB)MLS®系统销售的房屋总数达1,179套,高于上个月的1,047套。

尽管如此,10月的房屋销售量仍低于五年平均水平3.9%,低于十年平均水平0.9%。

截至2024年10月的年度累计销售量达到11,662套,比2023年同期增长9.4%。

“渥太华的市场呈现积极变化,销售活动有所增加。”OREB主席Curtis Fillier表示。“特别有趣的是,今年的市场活动一直维持稳定,而不是典型的季节性波动。消费者信心在逐步增强,尤其是在加拿大央行连续降息的背景下,尽管许多人仍在等待进一步的降息。”

50个基点的降息或许带来了一些乐观情绪,尤其是在安大略省发布秋季经济声明后,该声明将新建住房目标下调至81,300套,再次降低了预期,远低于省政府2024年建设125,000套新住房的目标。安省政府指出,高利率和艰难的经济环境给房屋建设者带来了持续挑战。

“供应问题依然存在。”Fillier说道,“渥太华的库存通常较紧张,并且很容易从平衡市场转向卖方市场,这可能会加剧可负担性和可及性问题。当前的形势呼吁新的行动和创新政策,以增加急需的库存。”

最近,OREB的领导层和志愿者前往国会山,与加拿大房地产协会(CREA)一同提出解决持续住房供应危机的具体方案。凭借对市场状况和消费者需求的丰富经验,房地产经纪人们提议通过投资外部建设技术(如预制房屋)和为非营利性建造的可负担房屋提供HST/GST减免,来促进住房供应。

价格数据一览:

MLS®房价指数(HPI)相比平均或中位数价格衡量更为准确,能更好地跟踪价格趋势。

  • 2024年10月的MLS® HPI综合基准价格为639,500加元,比2023年10月增长了0.4%。

  • 单户住宅的基准价格为724,500加元,同比上涨0.7%。

  • 相比之下,联排/排屋单位的基准价格为506,900加元,同比增长1.6%。

  • 公寓基准价格为407,500加元,同比下降3.4%。

  • 2024年10月的平均房屋销售价格为668,690加元,同比上升1.2%。年度累计的平均价格为678,081加元,同比上升0.9%。

  • 2024年10月所有房屋销售的总金额为7.883亿加元,比2023年10月增长了47.7%。

OREB提醒,平均销售价格可用于长期趋势分析,但不应作为具体房产增值或贬值的指标。平均销售价格的计算基于所有售出房产的总金额,不同社区的价格会有所不同。

库存及新上市房源数据一览:

2024年10月的新上市房源数量较2023年10月增加了10.4%,共有2,089套新的住宅房源。新上市房源比五年平均水平高6.7%,比十年平均水平高出17%。

截至2024年10月底,活跃住宅房源总数为3,354套,比2023年10月增长了8.9%。活跃房源数量比五年平均水平高出40.6%,比十年平均水平高出6.7%。

截至2024年10月底,市场库存为2.8个月,而2023年10月为3.8个月。库存月数指的是以当前销售速度售完所有库存所需的时间。
(数据来源:渥太华地产局OREB)

Read

渥太华房价【红宝地产】2024.9月房市数据报告

渥太华的 MLS® 房屋销售在市场变化中保持健康

2024 年 9 月,通过渥太华房地产委员会(OREB)MLS® 系统销售的房屋数量总计 1,047 套,比 2023 年 9 月增长 11.4%。

9 月的房屋销售量比五年平均水平低 17.4%,比十年平均水平低 15.4%。

截至 2024 年 9 月,年初至今的房屋销售总计 10,485 套,比 2023 年同期增长 6.4%。

“在我们应对不断变化的住房市场时,渥太华的秋季市场前景依然健康,”OREB 主席 Curtis Fillier 说道。“销售活跃,价格保持稳定。与此同时,买卖双方正在重新评估他们的购买力,因为关于未来进一步降息、延长贷款摊销期以及提高受保按揭价格上限的消息正在出现。”

Fillier 还表示:“最近有一些令人鼓舞的政策发展,这将刺激需求。但渥太华的市场通常不存在需求问题——我们有长期的供应问题。我们在市内没有建足够的房屋,也没有建造足够适合‘缺失的中间’(missing middle)的房屋。”

加拿大按揭与住房公司(CMHC)最近报告称,渥太华的“按人口调整后的建设量接近 10 年来的最低水平”。渥太华市的一份进展报告显示,截至 8 月底,渥太华仅达到了其年度住房目标的 22%。

——价格

MLS® 房屋价格指数(HPI)追踪价格趋势,准确性远远超过使用平均价格或中位数价格的测量方法。

2024 年 9 月,整体 MLS® HPI 综合基准价格为 642,800 加元,比 2023 年 9 月增长 0.2%。 单户住宅的基准价格为 729,000 加元,同比增长 0.5%。 相比之下,联排别墅/排屋单元的基准价格为 500,000 加元,同比下降 1.7%。 公寓的基准价格为 414,200 加元,比去年同期下降 1.3%。 2024 年 9 月销售房屋的平均价格为 685,551 加元,比 2023 年 9 月增长 1.4%。更全面的年初至今平均价格为 679,082 加元,同比增加 0.9%。 2024 年 9 月所有房屋销售的总金额为 7.177 亿加元,比 2023 年 9 月增长 12.9%。 OREB 警告,平均售价在长期趋势判断中有用,但不应作为具体房产价值上涨或下跌的指标。平均售价的计算基于所有售出的房产总金额,价格会因不同社区而异。

——库存和新房源

新房源数量比 2023 年 9 月增加了 3.9%,2024 年 9 月有 2,343 个新住宅房源。新房源比五年平均水平高 4.7%,比十年平均水平高 11.6%。 2024 年 9 月底的活跃住宅房源数量为 3,529 套,比 2023 年 9 月增加了 16.9%。活跃房源比五年平均水平高 43.3%,比十年平均水平高 4.6%。 2024 年 9 月底的库存月数为 3.4 个月,高于 2023 年 9 月的 3.2 个月。库存月数是指以当前的销售活动速度售完当前库存所需的月数。


(数据来源:渥太华地产局OREB)

Read

渥太华房价【红宝地产】2024.8月房市数据报告

渥太华火热的夏季房市预计将延续至秋季

通过渥太华房地产委员会(OREB)MLS®系统售出的房屋数量在2024年8月总计1,100套,比2023年8月增长了10.2%。

8月的房屋销售量比五年平均水平低11.4%,比十年平均水平低14.1%。

截至2024年8月,年初至今的房屋销售总数为9,444套,比2023年同期增长了6.0%。

“作为一个季节性市场,整个夏季保持持续的活动水平非常令人鼓舞。” OREB候任主席Paul Czan表示,“再加上加拿大央行连续第三次降息,我们预计秋季市场将会更加活跃。”

“房地产经纪人深知,大多数买家的首要关注点仍然是负担能力。随着大量新房源进入市场,价格保持稳定,买家并不急于行动,他们依旧保持谨慎,花时间寻找适合自己需求和预算的房产。因此,卖家需要保持耐心,并与能够使用最新社区级数据和洞察的房地产经纪人合作,以正确的价格为房产定价,并制定销售策略。”

价格:

MLS®房价指数(HPI)跟踪的价格趋势比使用平均或中位价格衡量的要更为准确。

2024年8月的整体MLS® HPI综合基准价格为646,000加元,比2023年8月下降了0.3%。 8月独立住宅的基准价格为732,500加元,同比下降0.3%。 相比之下,联排别墅的基准价格为502,200加元,比去年同期上涨了0.3%。 公寓的基准价格为416,800加元,同比下降了1.2%。 2024年8月售出的房屋平均价格为660,341加元,比2023年8月上涨了0.3%。年初至今的综合平均价格为678,327加元,比2023年8月上涨了0.9%。 2024年8月所有房屋销售的总成交额为7.263亿加元,比2023年8月增长了10.5%。 OREB提醒,平均售价有助于随着时间推移建立趋势,但不应作为特定房产价格上涨或下跌的指标。平均售价的计算基于售出的所有房产的总成交额。不同社区的价格会有所差异。

库存和新挂牌:

2024年8月新挂牌住宅数量比2023年8月增长了0.2%。8月新增住宅挂牌数量为1,907套,新挂牌量比五年平均水平高出0.2%,比十年平均水平高出0.9%。 2024年8月底活跃住宅挂牌数量为3,324套,比2023年8月增长了25.8%。活跃挂牌量比五年平均水平高出46.5%,但比十年平均水平低1.3%。 2024年8月底的库存月份数为3.0个月,高于2023年8月的2.6个月。库存月份数是指按照当前的销售活动水平,卖完现有库存所需的时间。


(数据来源:渥太华地产局OREB)

Read

OTTAWA REAL ESTATE - SEPTEMBER STATS (2024)

Ottawa’s MLS® Home Sales Healthy Amid a Shifting Market

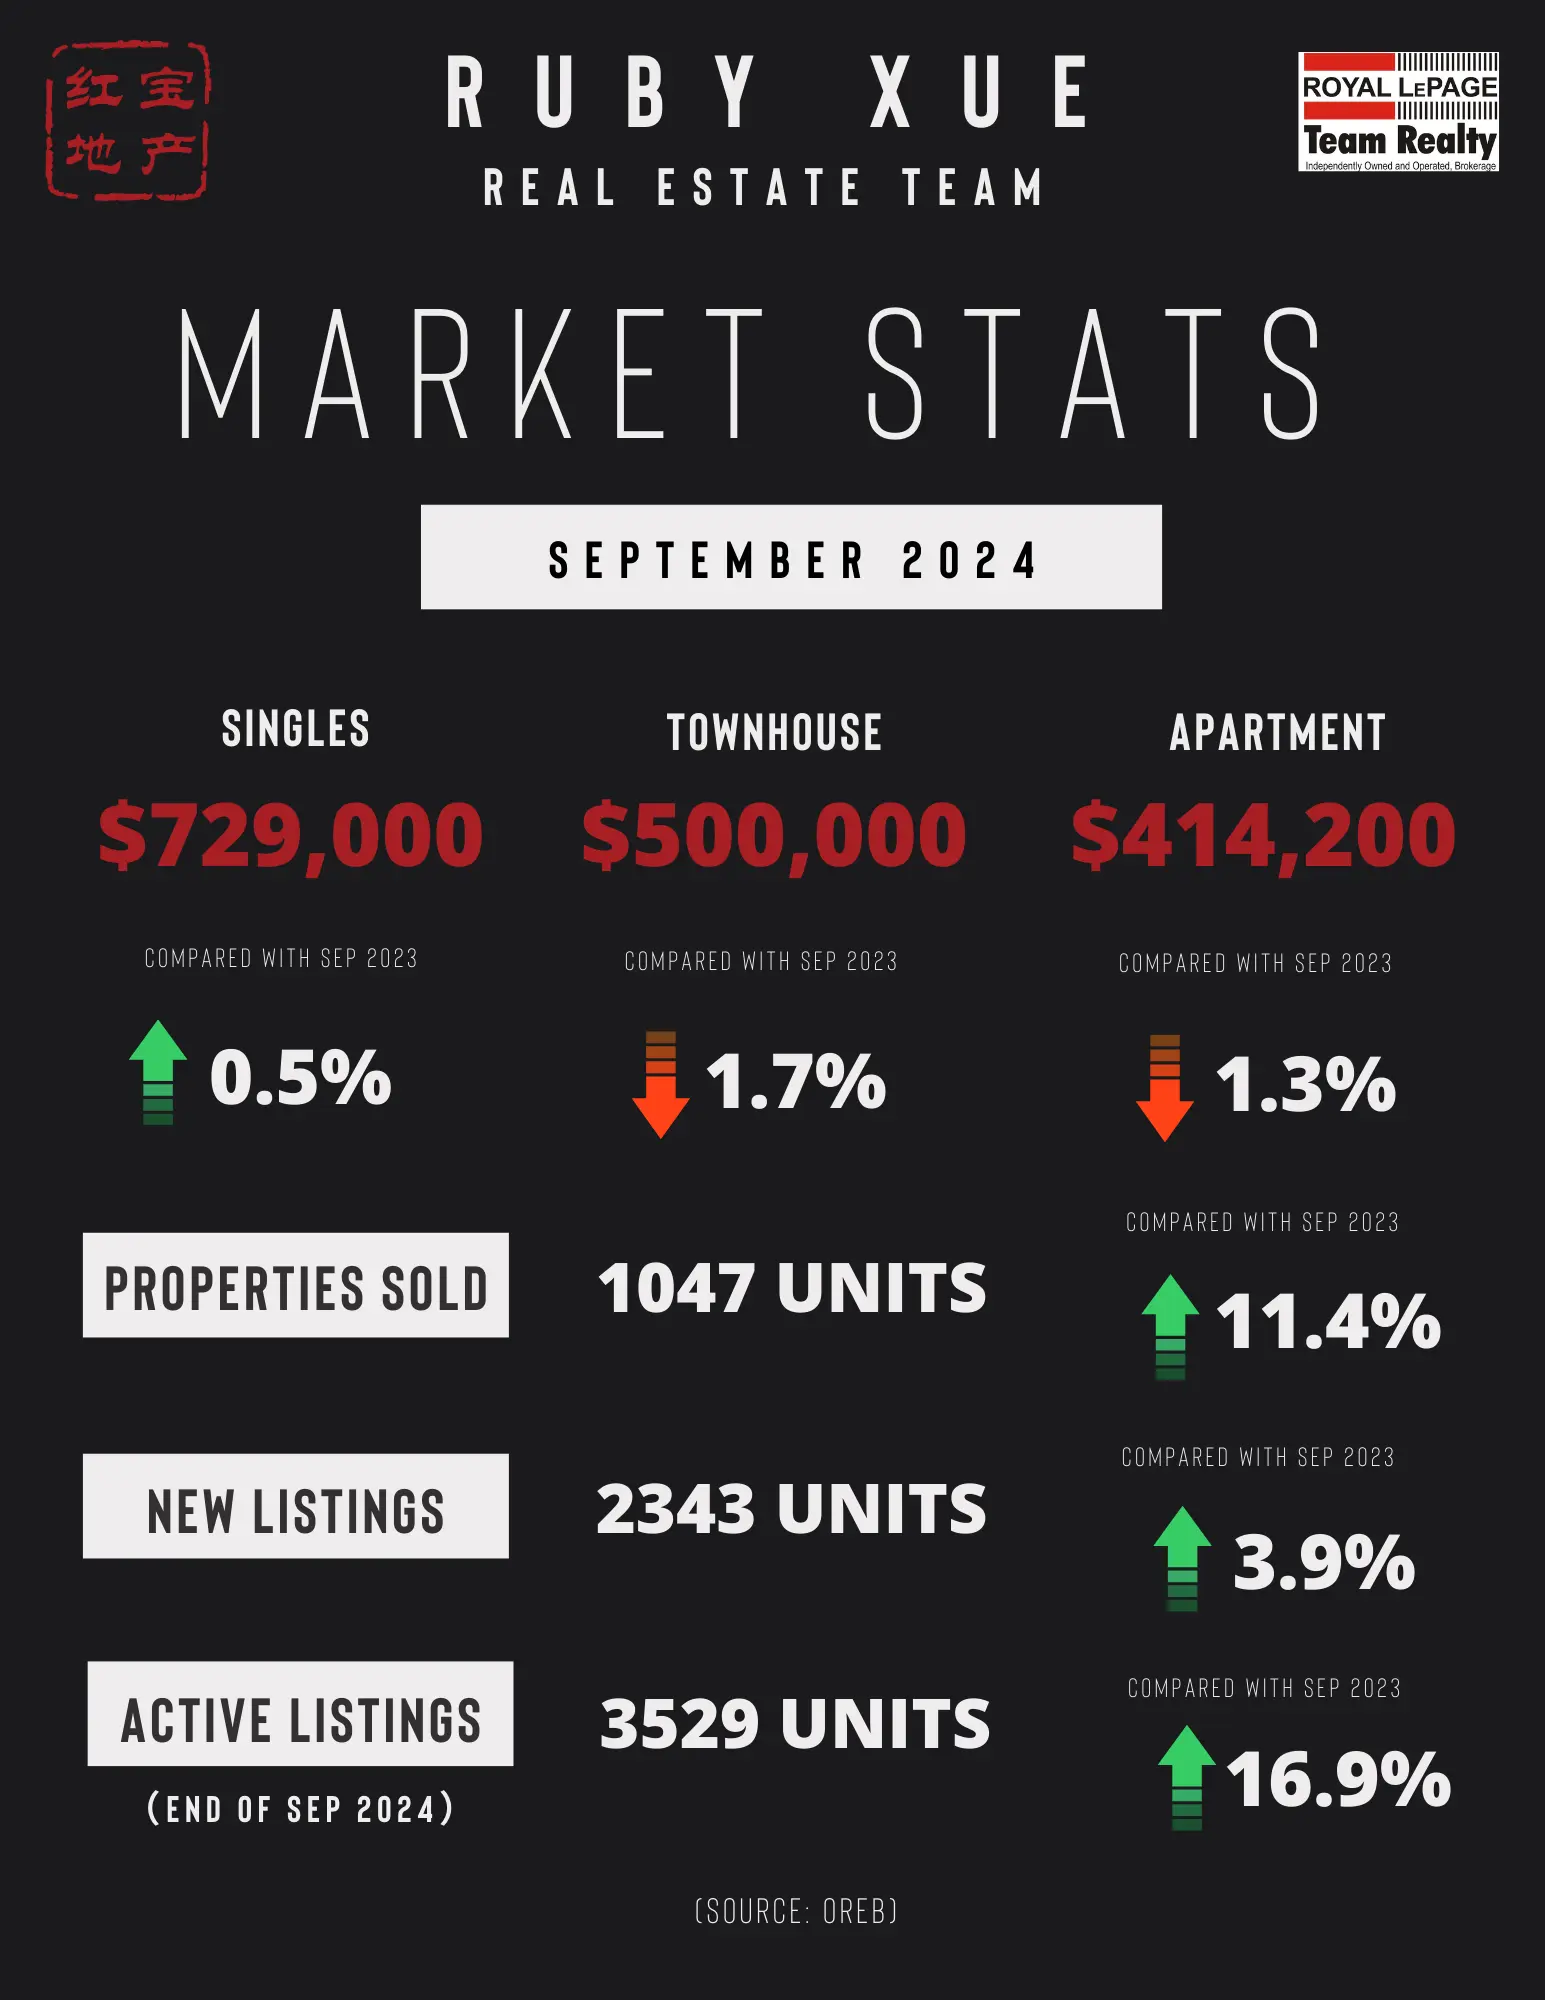
The number of homes sold through the MLS® System of the Ottawa Real Estate Board (OREB) totaled 1,047 units in September 2024. This was an 11.4% increase from September 2023.  

Home sales were 17.4% below the five-year average and 15.4% below the 10-year average for the month of September.  

On a year-to-date basis, home sales totaled 10,485 units in September 2024 — an increase of 6.4% from the same period in 2023.  

“As we navigate a shifting housing market, Ottawa’s fall outlook is healthy,” says OREB President Curtis Fillier. “Activity is robust with an uptick in sales and prices remaining steady. Meanwhile, both buyers and sellers are rethinking their purchasing power amidst news about additional interest rate cuts on the horizon, longer amortizations, and increased price caps for insured mortgages.” 

“There have been encouraging policy developments recently that will stimulate demand,” says Fillier. “But Ottawa’s market does not typically have demand problems — we have chronic supply issues. We’re not building enough homes in the city, and we’re not building enough of the right homes to address the ‘missing middle.’”  

The Canada Mortgage and Housing Corporation (CMHC) recently reported that Ottawa’s “population-adjusted construction is at its lowest level in nearly 10 years.” A City of Ottawa progress report shows that Ottawa is only at 22 per cent of its annual housing target at the end of August.  

By the Numbers – Prices: 

The MLS® Home Price Index (HPI) tracks price trends far more accurately than is possible using average or median price measures. 

  • The overall MLS® HPI composite benchmark price was $642,800 in September 2024, an increase of 0.2% from September 2023.  

    • The benchmark price for single-family homes was $729,000, up 0.5% on a year-over-year basis in September.  

    • By comparison, the benchmark price for a townhouse/row unit was $500,000, down 1.7% compared to a year earlier.  

    • The benchmark apartment price was $414,200, down 1.3% from year-ago levels. 

  • The average price of homes sold in September 2024 was $685,551 increasing 1.4% from September 2023. The more comprehensive year-to-date average price was $679,082, increasing by 0.9% from September 2023.  

  • The dollar volume of all home sales in September 2024 was $717.7 million, up 12.9% from September 2023. 

OREB cautions that the average sale price can be useful in establishing trends over time but should not be used as an indicator that specific properties have increased or decreased in value. The calculation of the average sale price is based on the total dollar volume of all properties sold. Prices will vary from neighbourhood to neighbourhood.  

By the Numbers – Inventory & New Listings 

  • The number of new listings saw an increase of 3.9% from September 2023. There were 2,343 new residential listings in September 2024. New listings were 4.7% above the five-year average and 11.6% above the 10-year average for the month of September. 

  • Active residential listings numbered 3,529 units on the market at the end of September 2024, a gain of 16.9% from September 2023. Active listings were 43.3% above the five-year average and 4.6% above the 10-year average for the month of September. 

  • Months of inventory numbered 3.4 at the end of September 2024, up from 3.2 in September 2023. The number of months of inventory is the number of months it would take to sell current inventories at the current rate of sales activity. 

    (SOURCE: OREB)

Read

OTTAWA REAL ESTATE - AUGUST STATS (2024)

Ottawa’s Hot Summer Market Expected to Extend into Fall

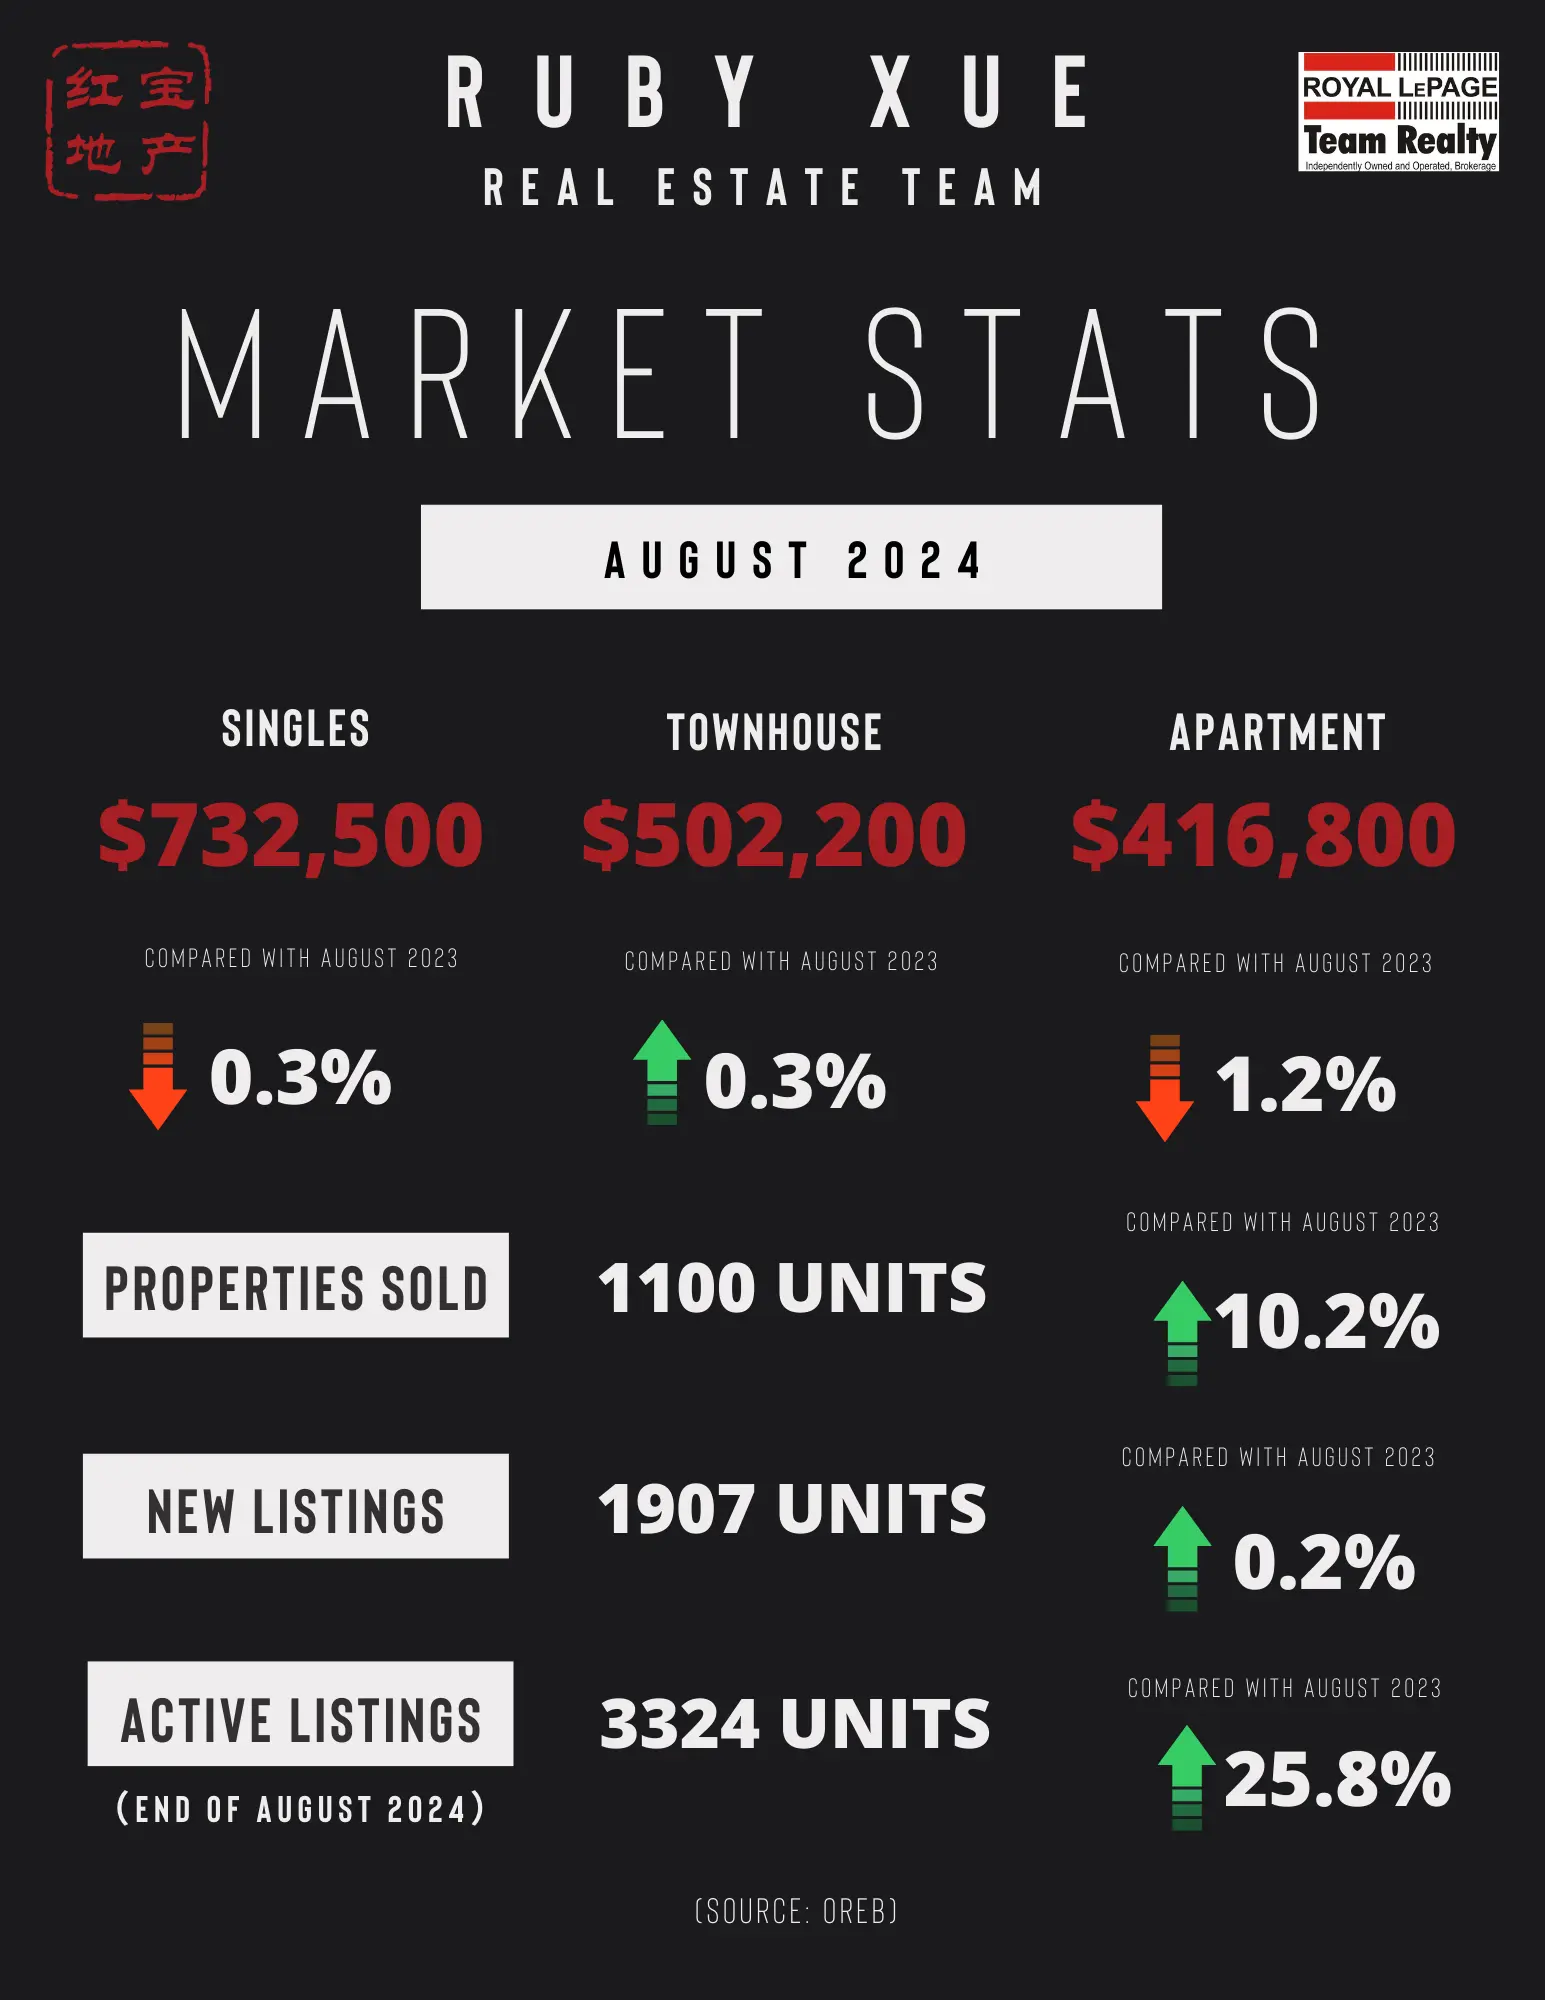
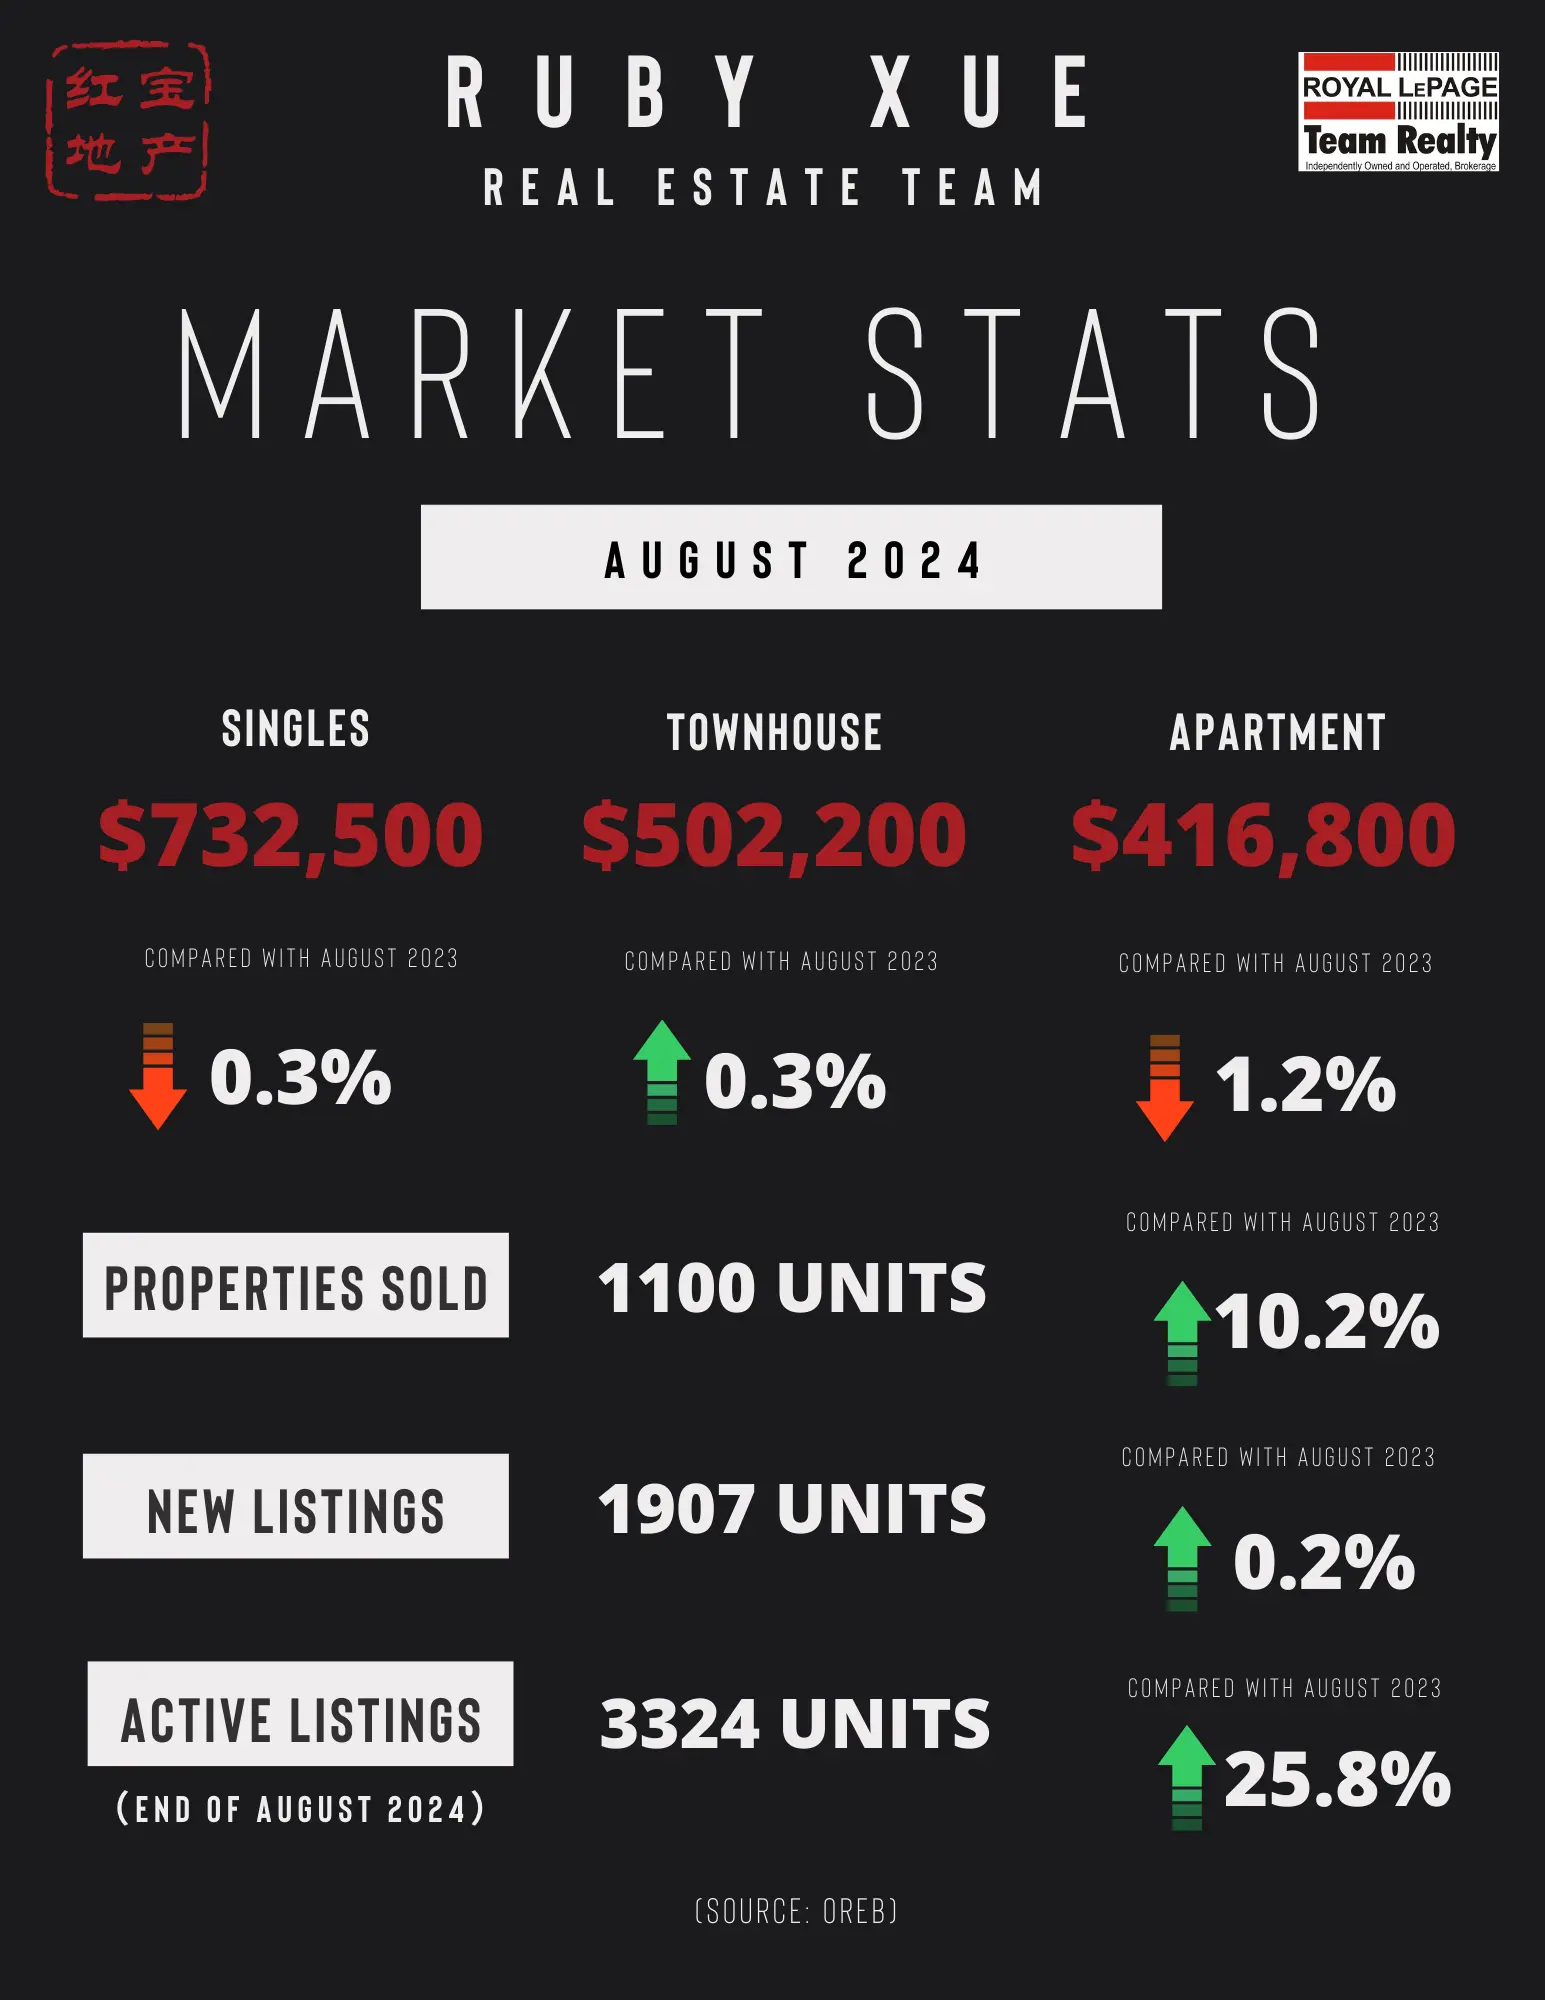
The number of homes sold through the MLS® System of the Ottawa Real Estate Board (OREB) totaled 1,100 units in August 2024. This was a 10.2% increase from August 2023.

Home sales were 11.4% below the five-year average and 14.1% below the 10-year average for the month of August.

On a year-to-date basis, home sales totaled 9,444 units in August 2024 — an increase of 6.0% from the same period in 2023.

“Being a seasonal market, it’s very encouraging to see sustained levels of activity throughout the whole summer,” says OREB President-elect Paul Czan. “And coupled with a third consecutive interest rate drop from the Bank of Canada, we are anticipating a heated market in the fall.”

“REALTORS® know firsthand how affordability remains a top concern for most buyers. With a stream of new listings hitting the market and prices holding steady, buyers are not moving with urgency. They are still using caution and taking their time to find the right property for their needs and budget. As such, sellers need to be patient and work with a REALTOR® who can use the latest neighbourhood-level data and insights to properly price their property and build a selling strategy.”

By the Numbers – Prices:

The MLS® Home Price Index (HPI) tracks price trends far more accurately than is possible using average or median price measures.

  • The overall MLS® HPI composite benchmark price was $646,000 in August 2024, a decrease of 0.3% from August 2023.

    • The benchmark price for single-family homes was $732,500, down 0.3% on a year-over-year basis in August.

    • By comparison, the benchmark price for a townhouse/row unit was $502,200, up 0.3% compared to a year earlier.

    • The benchmark apartment price was $416,800, down 1.2% from year-ago levels.

    • The average price of homes sold in August 2024 was $660,341 increasing 0.3% from August 2023. The more comprehensive year-to-date average price was $678,327, increasing by 0.9% from August 2023.

    • The dollar volume of all home sales in August 2024 was $726.3 million, up 10.5% from August 2023.

OREB cautions that the average sale price can be useful in establishing trends over time but should not be used as an indicator that specific properties have increased or decreased in value. The calculation of the average sale price is based on the total dollar volume of all properties sold. Prices will vary from neighbourhood to neighbourhood.

By the Numbers – Inventory and New Listings:

  • The number of new listings saw an increase of 0.2% from August 2023. There were 1,907 new residential listings in August 2024. New listings were 0.2% above the five-year average and 0.9% above the 10-year average for the month of August.

    • Active residential listings numbered 3,324 units on the market at the end of August 2024, a gain of 25.8% from August 2023. Active listings were 46.5% above the five-year average and 1.3% below the 10-year average for the month of August.

    • Months of inventory numbered 3.0 at the end of August 2024, up from 2.6 in August 2023. The number of months of inventory is the number of months it would take to sell current inventories at the current rate of sales activity.

(SOURCE: OREB)

Read

首次降息后,渥太华房市现状2024大揭秘!

大家好,这里是渥太华红宝地产。自从央行宣布首次降息以来,2024年渥太华的房地产市场出现了哪些新变化?这对于买家和卖家来说,又意味着什么机会和挑战呢?

📉 市场现状:降息后的市场活跃度如何?房价走势有什么变化?

🏡 买家建议:降息带来了更低的贷款利率,是不是入市的好时机?有哪些注意事项?

💼 卖家策略:面对市场调整,卖家该如何定价和准备房屋上市,才能吸引更多买家? 快来看看我们为你准备的最新房市分析和专业建议,助你在这个变动的市场中做出最明智的决策!

💬 有任何问题或想法,欢迎在评论区留言,我们一起讨论吧! 如果您在渥太华有任何房产方面的需要,欢迎联系红宝地产。

Ruby Xue Real Estate Broker / Team Leader of Ruby Xue Real Estate Team Royal Lepage Team Realty, Brokerage 🌟【ROYAL LEPAGE CHAIRMAN‘S CLUB NATIONAL TOP 2%】 🌟【TOP 100 TEAMS OF ROYAL LEPAGE TEAM REALTY 】 Office Address: 6-224 Hunt Club Rd, Ottawa ON K1V 1C1 Office Phone: 613-216-0057 Ottawa Home Selling | Ottawa Home Buying | Luxury Homes in Ottawa | Residential | Property Management | Condo | Commercial |Ottawa Realtor |Ottawa Real Estate | 渥太华买房卖房一条龙服务|渥太华华人地产经纪薛如冰RUBY XUE | 红宝地产

Read

渥太华房价【红宝地产】2024.7月房市数据报告

通过渥太华房地产委员会(OREB)MLS®系统销售的房屋数量在2024年7月达到了1,241套,比2023年7月增长了13.6%。

7月的房屋销售量比五年平均水平低了7.1%,比十年平均水平低了8.8%。从年初到7月为止,2024年房屋销售总量为8,349套,比2023年同期增长了5.5%。

“随着市场在夏季通常会放缓,7月的活动令人鼓舞,这可能预示着未来将会有更多的增长,”OREB主席Curtis Fillier表示。“买家的信心正在慢慢但稳步地恢复,而卖家也在持续增加新的房源。当然,这是否会转化为交易取决于我们社区中可用房产的类型和价格范围,因为供应和可负担性问题仍然存在。”

“虽然现在下结论还为时过早,但最近的政策变化可能会有所帮助,”Fillier表示。“加拿大央行连续两次降息,加上联邦政府为首次购房者购买新建房屋推出的30年按揭摊还期,这些措施将帮助一些买家。然而,这些是需求方的政策,而渥太华——以及全国许多城市——需要在供应方面采取行动。”

在其货币政策报告中,加拿大央行指出,市政区划限制和高额开发费用是长期存在的供应增长挑战。安大略省政府的最新数据显示,渥太华的住房开工率远远落后于目标,2024年目标为12,583套,但实际仅建成1,593套。OREB及其成员房地产经纪人继续倡导直接解决城市住房危机的方案,例如允许每块地建设四个单位并减少高昂的开发费用。

数据统计——价格:

MLS®房价指数(HPI)跟踪价格趋势,比使用平均或中位数价格的衡量方法更准确。

2024年7月,整体MLS® HPI综合基准价格为648,900加元,比2023年7月增长了0.1%。 单户住宅的基准价格为734,700加元,同比下降了0.1%。 相比之下,联排别墅/排屋单位的基准价格为506,100加元,同比增长3.4%。 公寓的基准价格为422,800加元,同比下降了0.9%。 2024年7月售出的房屋平均价格为679,610加元,比2023年7月下降了2.1%。更全面的年初至今的平均价格为681,082加元,比2023年7月增长了1.0%。 2024年7月所有房屋销售的总金额为8.433亿加元,比2023年7月增长了11.3%。

OREB称平均销售价格在长期趋势分析中具有参考价值,但不应作为特定房产增值或贬值的指标。平均销售价格的计算基于所有售出房产的总金额。不同社区的价格会有所不同。

数据统计——库存和新房源

新房源数量比2023年7月增长了17.1%。2024年7月新增住宅房源为2,231套。2024年7月底,活跃住宅房源数量为3,480套,比2023年7月增长了37.0%。2024年7月底的库存月数为2.8个月,高于2023年7月的2.3个月。库存月数是指以当前销售活动速度售罄现有库存所需的月份数。

(数据来源:渥太华地产局OREB)

Read

OTTAWA REAL ESTATE - JULY STATS (2024)

Ottawa’s MLS® Market Gains Momentum Heading into Summer

The number of homes sold through the MLS® System of the Ottawa Real Estate Board (OREB) totaled 1,241 units in July 2024. This was a 13.6% increase from July 2023.

Home sales were 7.1% below the five-year average and 8.8% below the 10-year average for the month of July.

On a year-to-date basis, home sales totaled 8,349 units in July 2024 — an increase of 5.5% from the same period in 2023.

“As the market pace typically slows in the summer, July’s activity is encouraging and could be a sign of more gains ahead,” says OREB President Curtis Fillier. “Buyer confidence is slowly but surely catching up while sellers continue to add a steady stream of new listings. Of course, the extent to which that translates into transactions depends on the type of properties and price points available in our communities as supply and affordability issues persist.”

“It’s too early to tell, but recent policy developments could be a boost,” says Fillier. “Two consecutive interest rate cuts by the Bank of Canada, coupled with the federal government’s introduction of 30-year amortization periods on mortgages for first-time homebuyers purchasing newly built homes, will help some buyers. However, these are demand policies and Ottawa — as well as many cities across the country — needs action on the supply side.”

In its Monetary Policy Report, the Bank of Canada points to municipal zoning restrictions and high development fees as long-standing standing challenges to supply growth. Recent data from the Ontario government shows Ottawa is significantly behind its housing starts goal having only built 1,593 homes out of its 12,583 target for 2024. OREB and its member REALTORS® continue to advocate for direct solutions to address the city’s housing crisis, such as allowing four units per lot and reducing costly development fees.

By the Numbers – Prices:

The MLS® Home Price Index (HPI) tracks price trends far more accurately than is possible using average or median price measures.

  • The overall MLS® HPI composite benchmark price was $648,900 in July 2024, an increase of 0.1% from July 2023.

    • The benchmark price for single-family homes was $734,700, down 0.1% on a year-over-year basis in July.

    • By comparison, the benchmark price for a townhouse/row unit was $506,100, up 3.4% compared to a year earlier.

    • The benchmark apartment price was $422,800, down 0.9% from year-ago levels.

  • The average price of homes sold in July 2024 was $679,610 decreasing 2.1% from July 2023. The more comprehensive year-to-date average price was $681,082, increasing by 1.0% from July 2023.

  • The dollar volume of all home sales in July 2024 was $843.3 million, up 11.3% from July 2023.


OREB cautions that the average sale price can be useful in establishing trends over time but should not be used as an indicator that specific properties have increased or decreased in value. The calculation of the average sale price is based on the total dollar volume of all properties sold. Prices will vary from neighbourhood to neighbourhood.

By the Numbers – Inventory & New Listings

  • The number of new listings saw an increase of 17.1% from July 2023. There were 2,231 new residential listings in July 2024. New listings were % below the five-year average and % below the 10-year average for the month of July.

  • Active residential listings numbered 3,480 units on the market at the end of July 2024, a gain of 37.0% from July 2023. Active listings were % above the five-year average and % below the 10-year average for the month of July.

  • Months of inventory numbered 2.8 at the end of July 2024, up from 2.3 in July 2023. The number of months of inventory is the number of months it would take to sell current inventories at the current rate of sales activity.

    (SOURCE: OREB)
Read
This website may only be used by consumers that have a bona fide interest in the purchase, sale, or lease of real estate of the type being offered via the website. The data relating to real estate on this website comes in part from the MLS® Reciprocity program of the PropTx MLS®. The data is deemed reliable but is not guaranteed to be accurate.