RSS

降息开始后,加拿大渥太华房市怎么样了!

🌟 大家好,我是渥太华地产经纪Ruby,今天要跟大家聊聊近期备受关注的一个话题——降息开始后渥太华房市的变化。

🏡 降息的影响: 自从加拿大央行宣布降息以来,渥太华的房地产市场发生了一些有趣的变化。降息意味着贷款利率降低,这对于购房者来说是一个重大利好消息。

📈 房价走势: 降息通常会刺激房地产市场,增加购房需求。那么,渥太华的房价是否因此上涨了呢?通过分析最新的数据和市场趋势,我们发现了几点值得注意的现象。

💡 购房建议: 对于想在渥太华购房的小伙伴,现在是一个好时机吗?我将分享一些实用的购房建议,帮助大家在这个变化多端的市场中做出明智的决策。

🔔 快来看看我的视频,了解更多关于降息后渥太华房市的详细分析吧!希望能为正在考虑买房卖房的你们提供一些帮助和参考。

Ruby Xue Real Estate Broker / Team Leader of Ruby Xue Real Estate Team Royal Lepage Team Realty, Brokerage 🌟【ROYAL LEPAGE CHAIRMAN‘S CLUB NATIONAL TOP 1%】 🌟【TOP 100 TEAMS OF ROYAL LEPAGE TEAM REALTY 】 Office Address: 6-224 Hunt Club Rd, Ottawa ON K1V 1C1 Office Phone: 613-216-0057 Ottawa Home Selling | Ottawa Home Buying | Luxury Homes in Ottawa | Residential | Property Management | Condo | Commercial |Ottawa Realtor |Ottawa Real Estate | 渥太华买房卖房一条龙服务|渥太华华人地产经纪薛如冰RUBY XUE | 红宝地产

Read

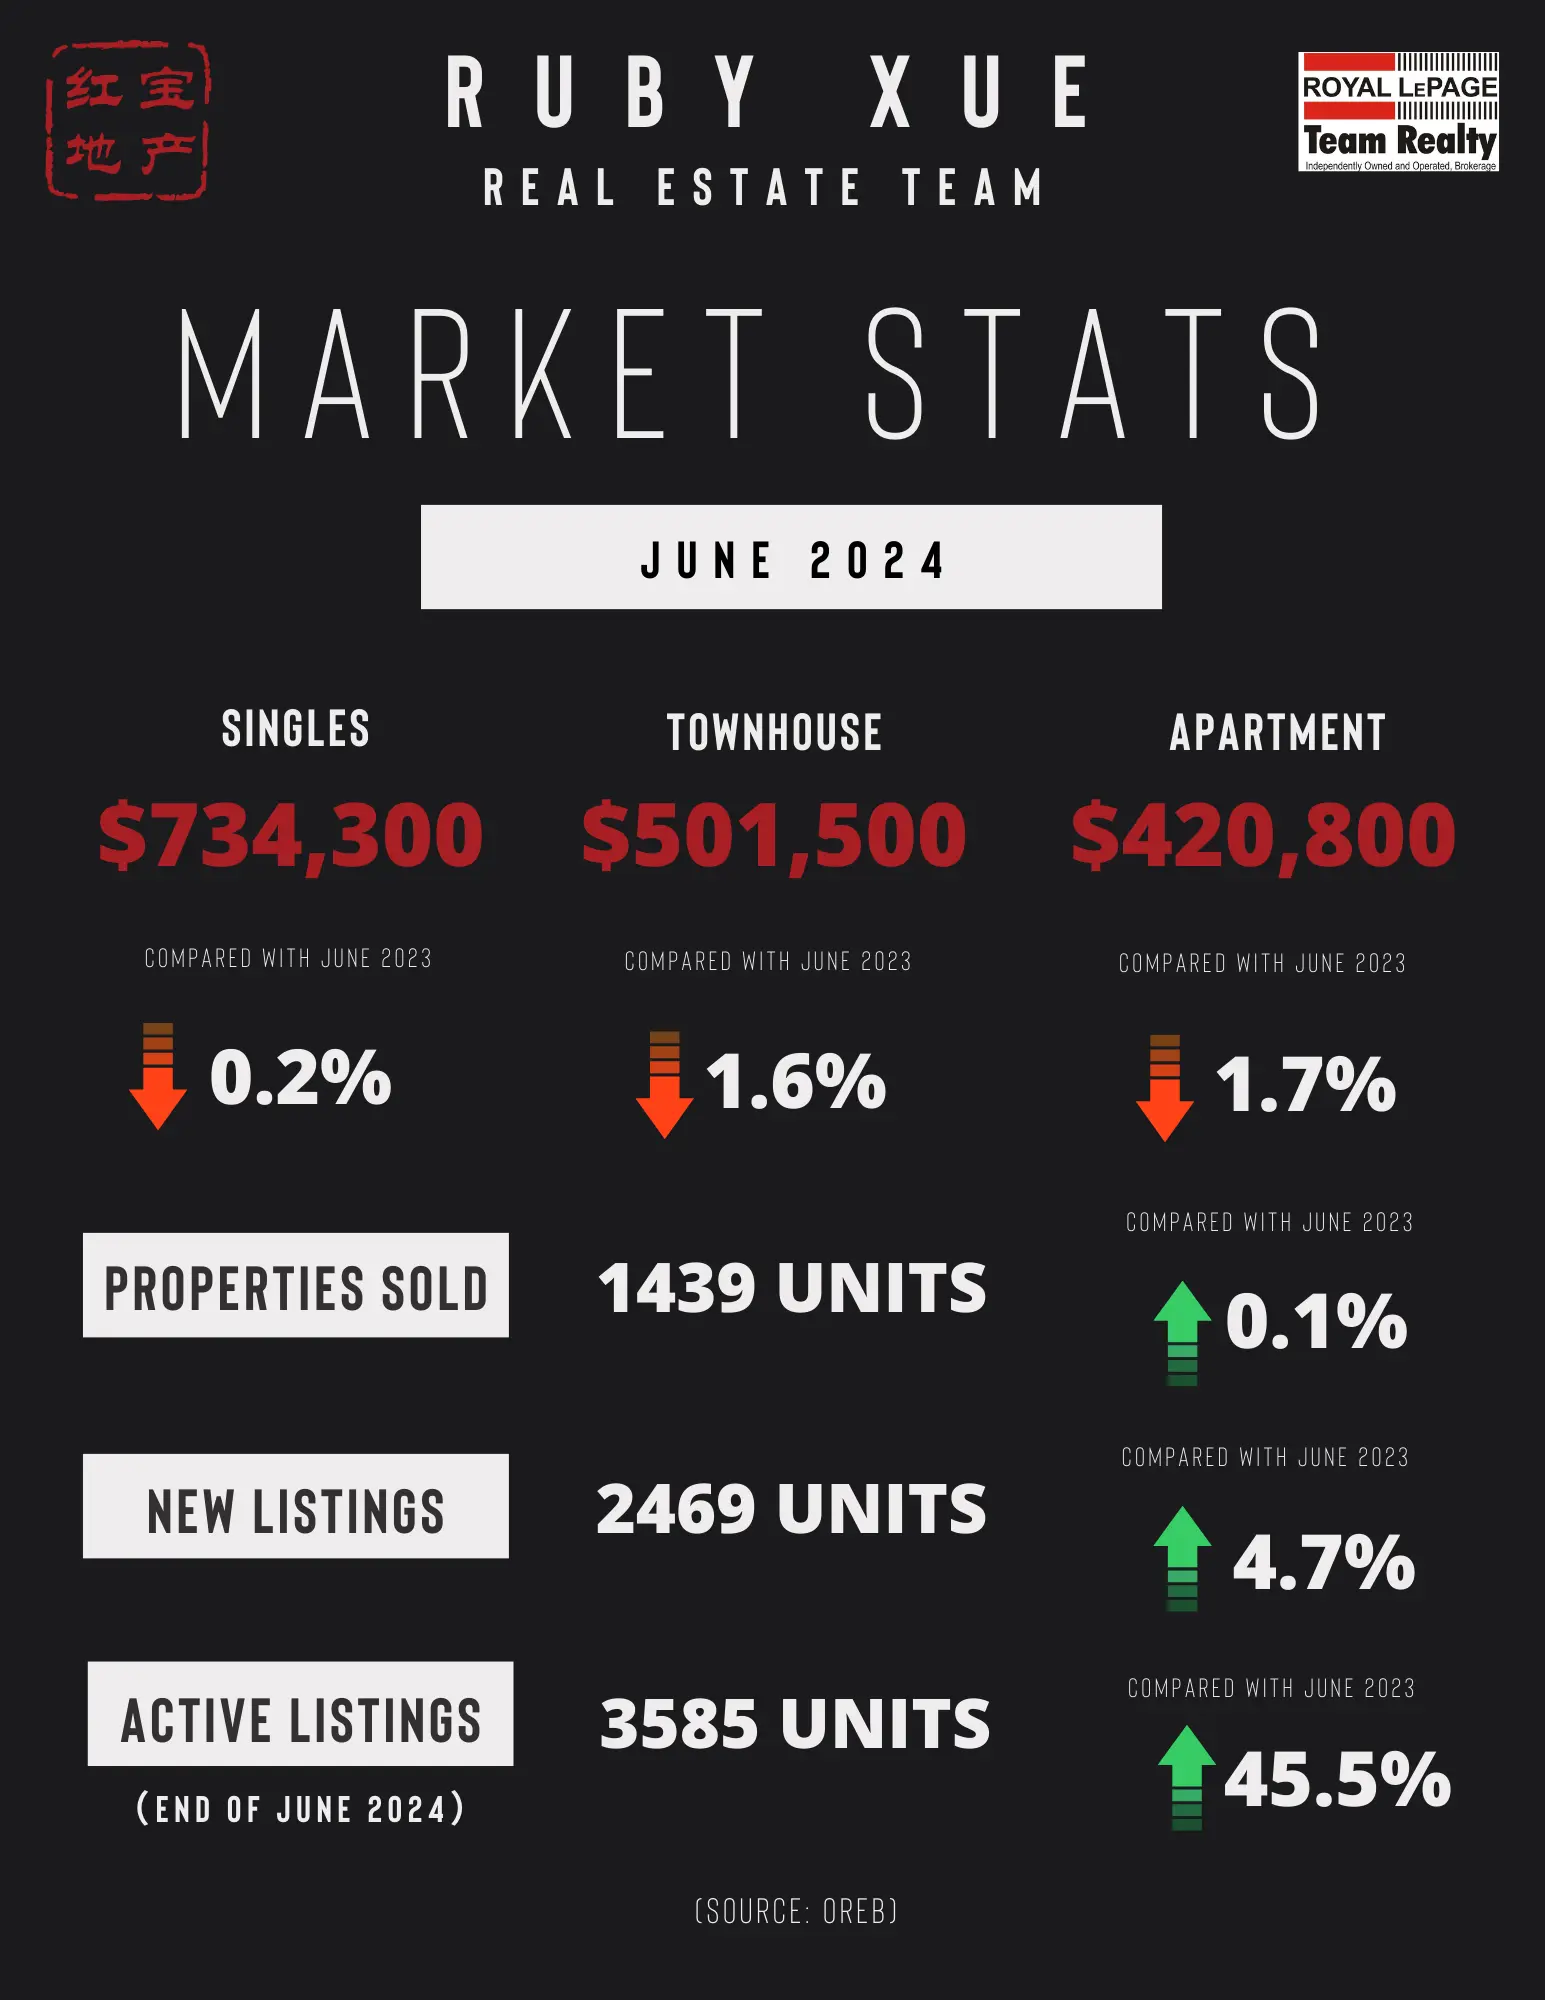
OTTAWA REAL ESTATE - JUNE STATS (2024)

Ottawa’s MLS® Activity Builds After Recovering from Prior Slowdown

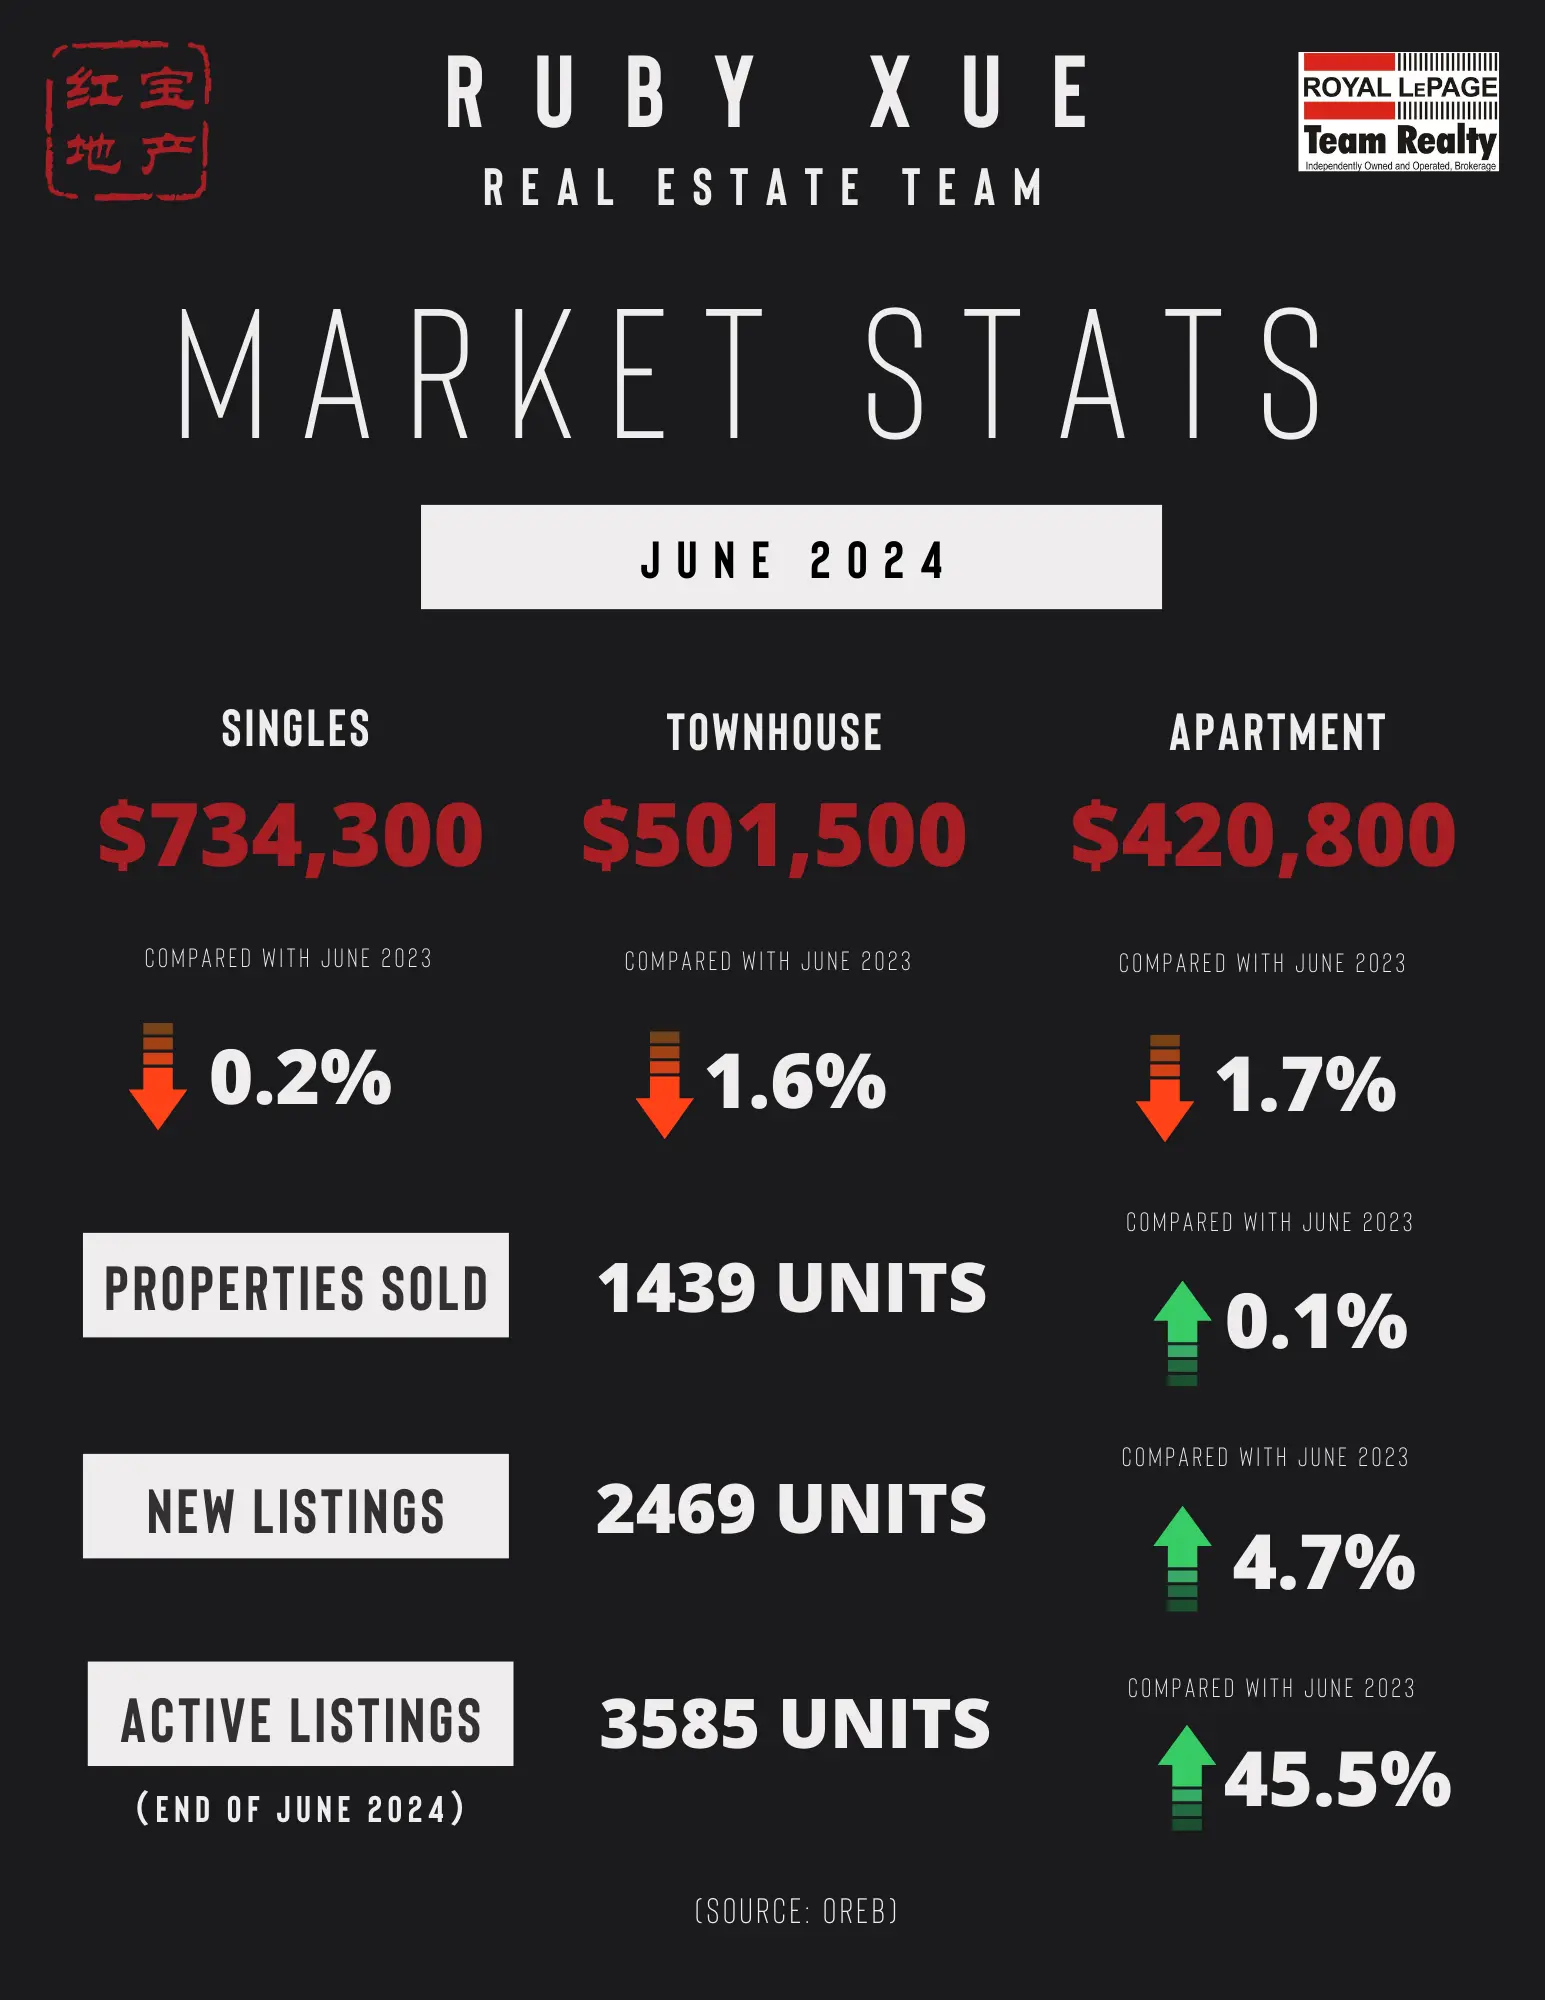
The number of homes sold through the MLS® System of the Ottawa Real Estate Board (OREB) totaled 1,439 units in June 2024. This was a marginal increase of 0.1% from June 2023.

Home sales were 7.5% below the five-year average and 13.2% below the 10-year average for the month of June.

On a year-to-date basis, home sales totaled 7,109 units over the first half of the year — an increase of 4.2% from the same period in 2023.

“Ottawa continues to see steady activity as we head into the summer market,” says OREB President Curtis Fillier. “Unlike recent years, buyers have more room to wait, evaluate and be selective when searching for the right property at the right price, leading to a slight uptick in the days on market. Sellers are making moves as evidenced by the inventory and listings. After recovering from last year’s slowdown, Ottawa’s market performance is nearly back on par and continues to make gains.

“It’s going to be an interesting summer and next half of the year. As confidence builds, there will be ample opportunities for both parties. Now is the time for sellers to ensure their property is at its best and priced appropriately to attract buyers who remain slightly reluctant. Buyers would do well to remember that inventory levels — and competition — can swing quickly in Ottawa’s tight market.”

By the Numbers – Prices:

The MLS® Home Price Index (HPI) tracks price trends far more accurately than is possible using average or median price measures.

  • The overall MLS® HPI composite benchmark price was $647,700 in June 2024, a decrease of 0.5% from June 2023.

    • The benchmark price for single-family homes was $734,300, down 0.2% on a year-over-year basis in June.

    • By comparison, the benchmark price for a townhouse/row unit was $501,500, down 1.6% compared to a year earlier.

    • The benchmark apartment price was $420,800, down 1.7% from year-ago levels.

  • The average price of homes sold in June 2024 was $686,535 increasing 0.5% from June 2023. The more comprehensive year-to-date average price was $681,345, increasing by 1.6% from the first six months of 2023.

  • The dollar volume of all home sales in June 2024 was $987.9 million, up 0.7% from June 2023.

OREB cautions that the average sale price can be useful in establishing trends over time but should not be used as an indicator that specific properties have increased or decreased in value. The calculation of the average sale price is based on the total dollar volume of all properties sold. Prices will vary from neighbourhood to neighbourhood.

By the Numbers – Inventory & New Listings

  • The number of new listings saw an increase of 4.7% from June 2023. There were 2,469 new residential listings in June 2024. New listings were 0.8% below the five-year average and 1% below the 10-year average for the month of June.

  • Active residential listings numbered 3,585 units on the market at the end of June 2024, a gain of 45.5% from June 2023. Active listings were 57.8% above the five-year average and 1.9% below the 10-year average for the month of June.

  • Months of inventory numbered 2.5 at the end of June 2024, up from 1.7 in June 2023. The number of months of inventory is the number of months it would take to sell current inventories at the current rate of sales activity.

(SOURCE: OREB)

Read

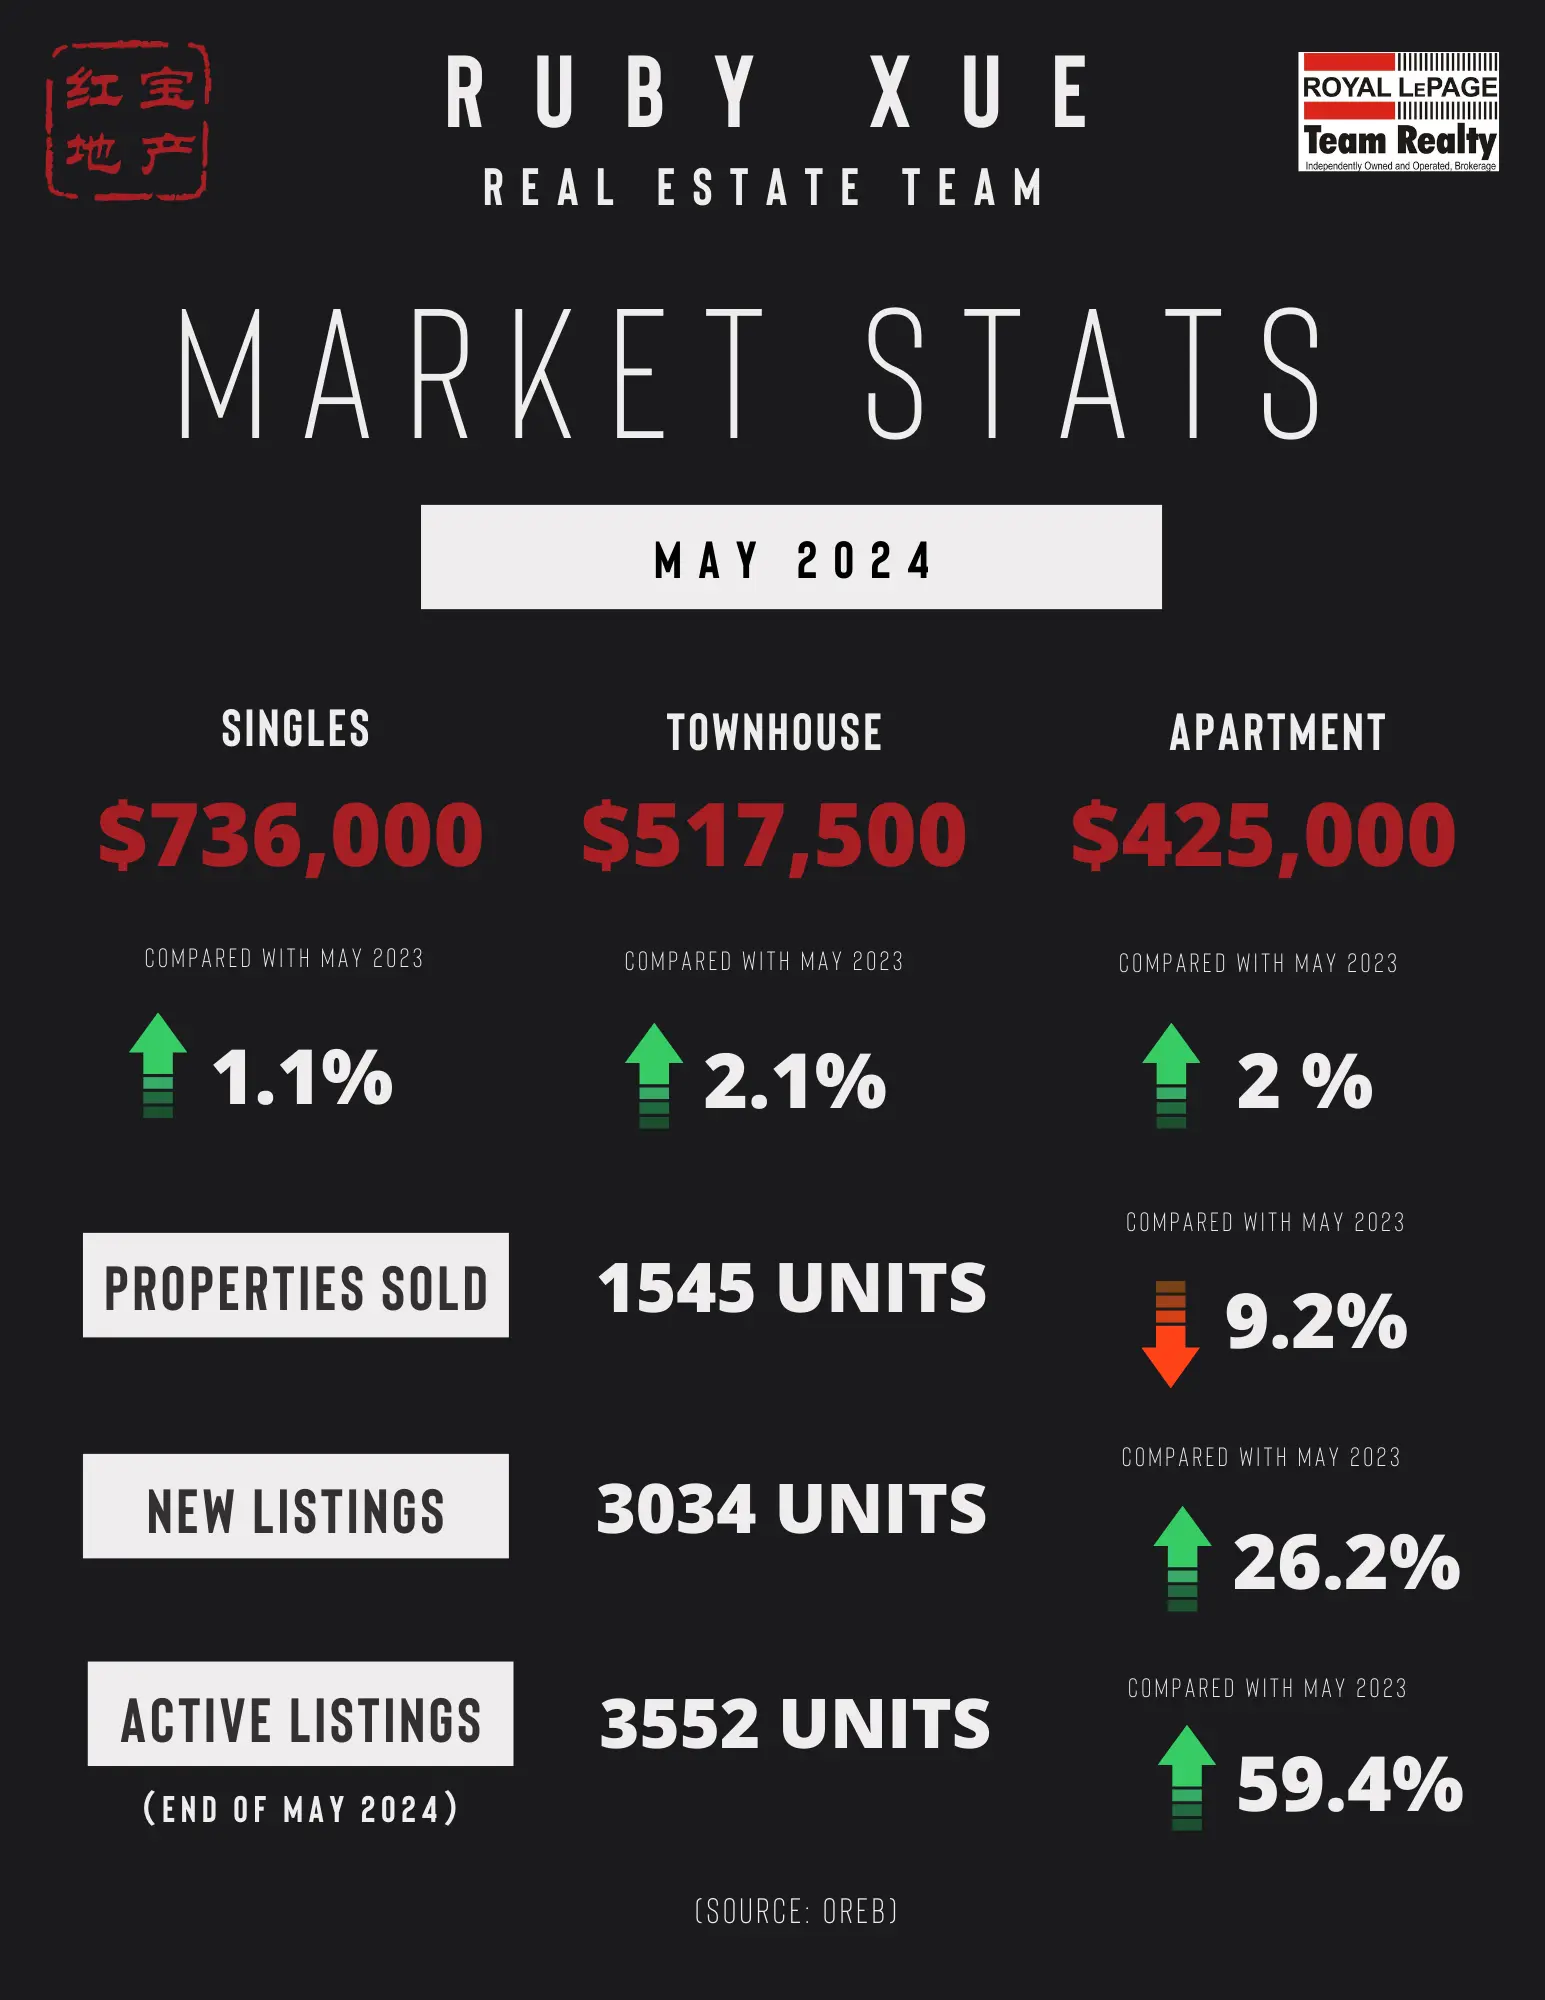
OTTAWA REAL ESTATE - MAY STATS (2024)

May MLS® Home Sales in Ottawa Smooth and Cautious

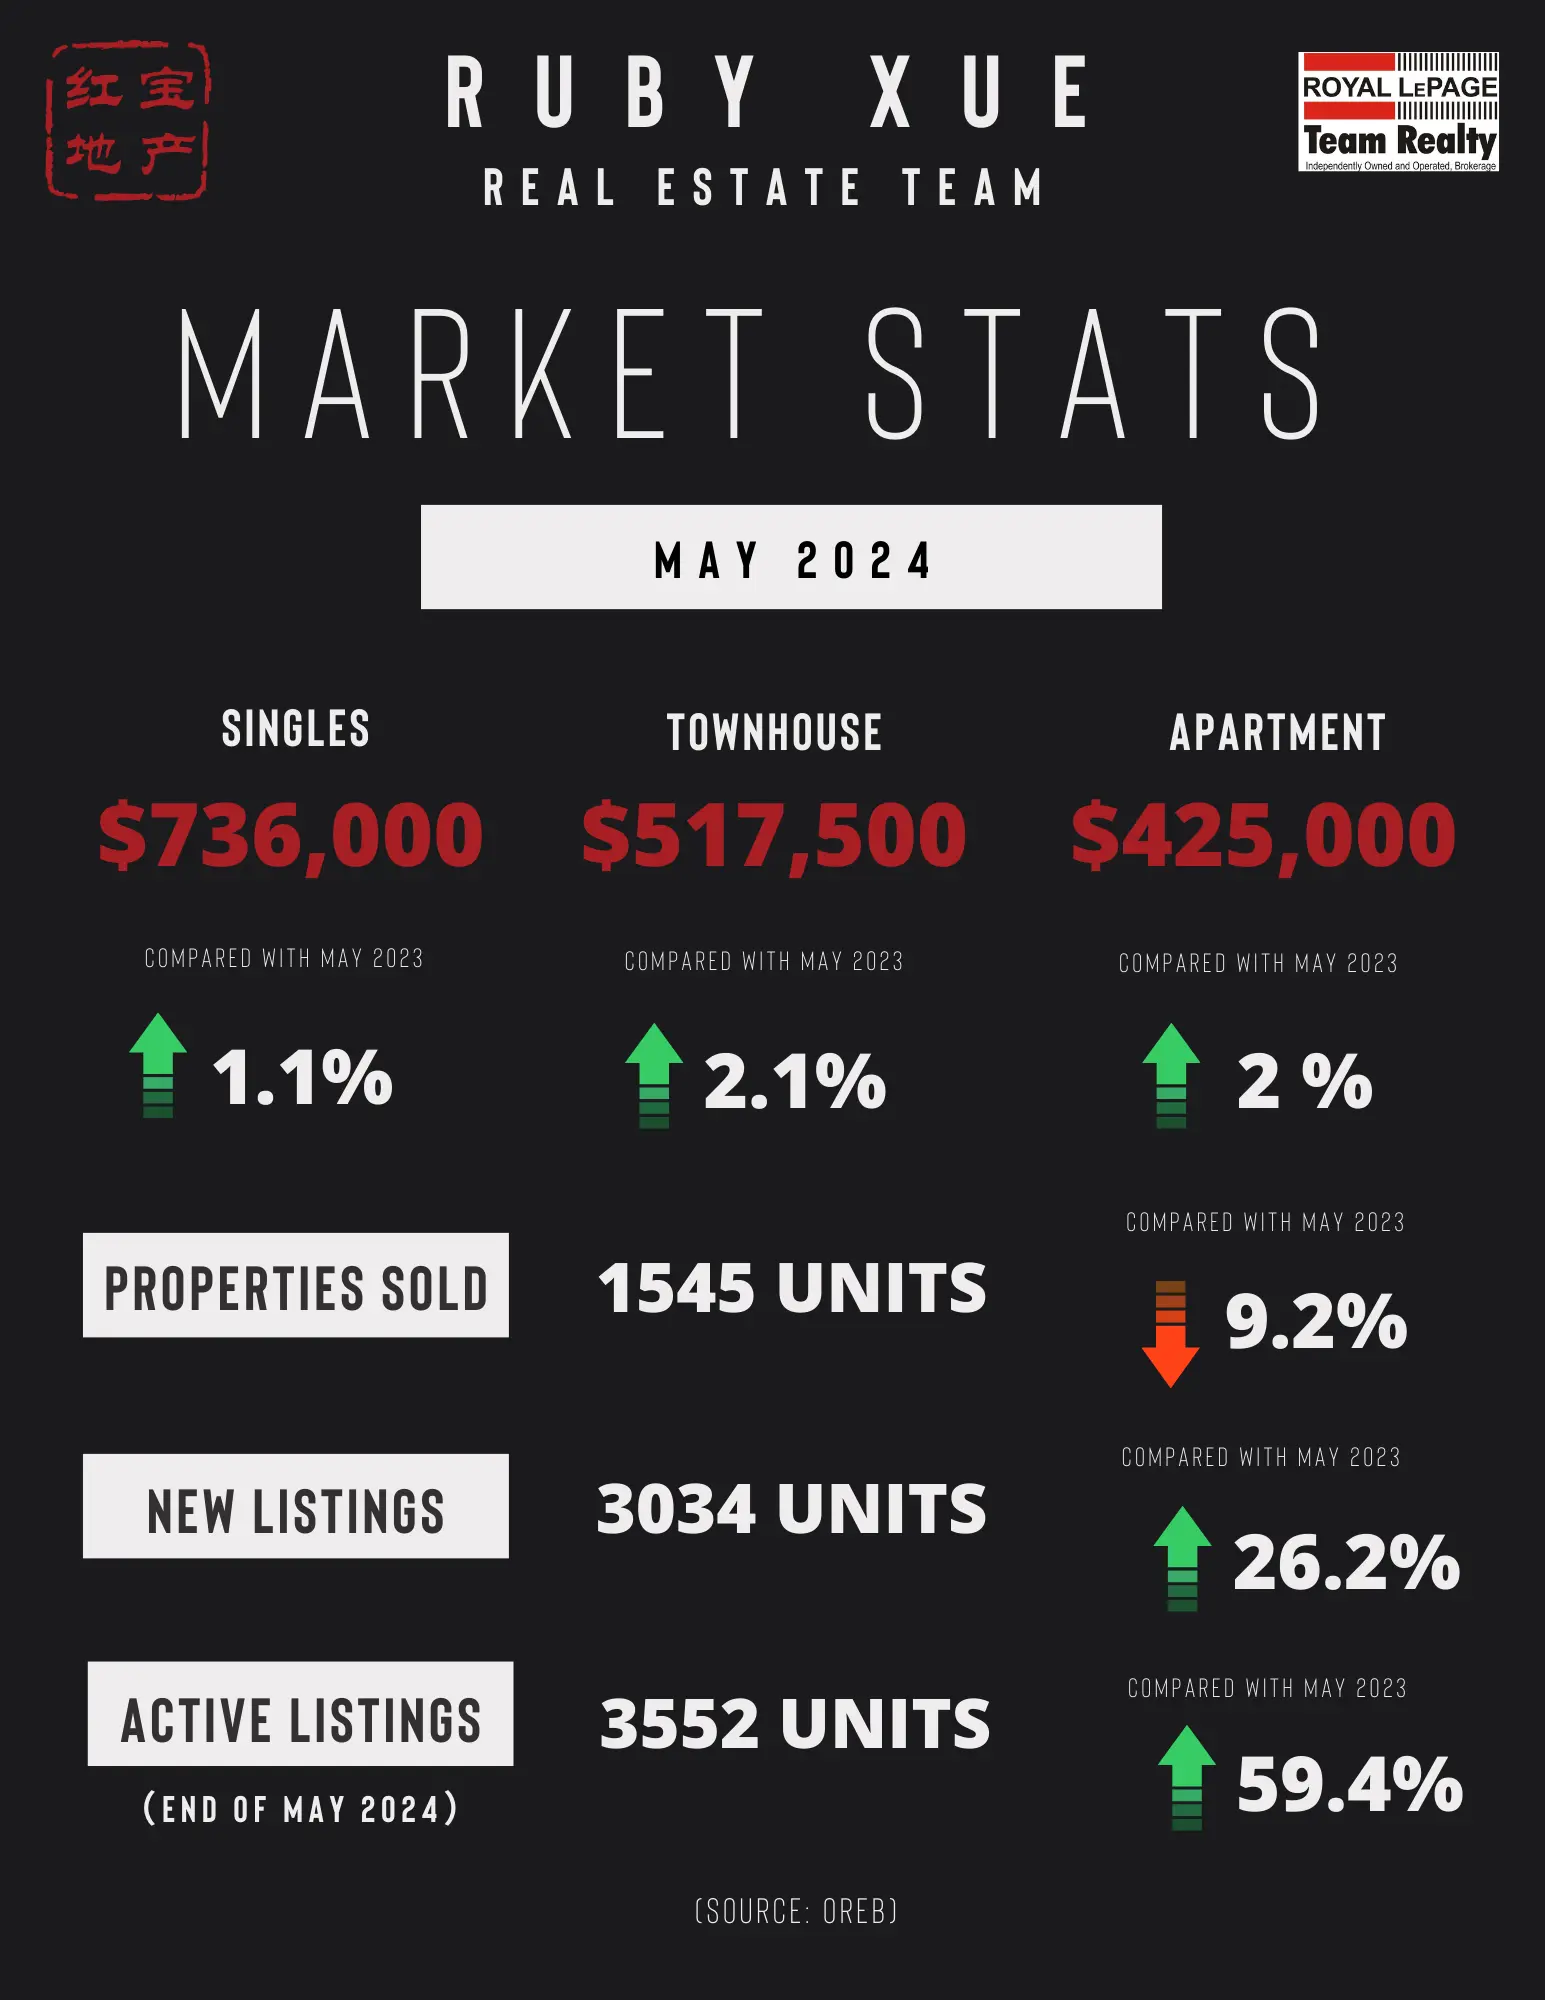
The number of homes sold through the MLS® System of the Ottawa Real Estate Board (OREB) totaled 1,545 units in May 2024. This was a decrease of 9.2% from May 2023.

Home sales were 3.7% below the five-year average and 13.2% below the 10-year average for the month of May.

On a year-to-date basis, home sales totaled 5,673 units over the first five months of the year — an increase of 5.2% from the same period in 2023.

“Ottawa’s early spring market was unsurprisingly steady,” says OREB President Curtis Fillier. “The increase in new listings indicate that sellers are more confident that properties are moving as more activity returns to the market. Some sellers, however, were likely waiting for the Bank of Canada’s interest rate announcement to see if it would affect their purchasing power. The first interest rate cut in four years is good news, but expectations still need to be managed as long as supply issues and high home prices persist.”

“Interest rate cuts, for example, can’t help get more homes built and make them affordable when the City of Ottawa is hiking development fees — a counterproductive move that OREB is firmly against.”

By the Numbers – Prices:

The MLS® Home Price Index (HPI) tracks price trends far more accurately than is possible using average or median price measures.

  • The overall MLS® HPI composite benchmark price was $651,300 in May 2024, a marginal gain of 1.2% from May 2023.

    • The benchmark price for single-family homes was $736,000, up 1.1% on a year-over-year basis in May.

    • By comparison, the benchmark price for a townhouse/row unit was $517,500, up 2.1% compared to a year earlier.

    • The benchmark apartment price was $425,000, up 2.0% from year-ago levels.

    • The average price of homes sold in May 2024 was $690,683 increasing 0.8% from May 2023. The more comprehensive year-to-date average price was $679,862, increasing by 1.8% from the first five months of 2023.

  • The dollar volume of all home sales in May 2024 was $1.06 billion, down 8.5% from the same month in 2023.

OREB cautions that the average sale price can be useful in establishing trends over time but should not be used as an indicator that specific properties have increased or decreased in value. The calculation of the average sale price is based on the total dollar volume of all properties sold. Prices will vary from neighbourhood to neighbourhood.

By the Numbers – Inventory & New Listings

  • The number of new listings saw an increase of 26.2% from May 2023. There were 3,034 new residential listings in May 2024. New listings were 23.2% above the five-year average and 10.2% above the 10-year average for the month of May.

  • Active residential listings numbered 3,552 units on the market at the end of May 2024, a gain of 59.4% from May 2023. Active listings were 72.2% above the five-year average and 2.9% below the 10-year average for the month of May.

  • Months of inventory numbered 2.3 at the end of May 2024, up from 1.3 in May 2023. The number of months of inventory is the number of months it would take to sell current inventories at the current rate of sales activity.

(SOURCE: OREB)

Read

OTTAWA REAL ESTATE - APRIL STATS (2024)

Modest Gains Across Ottawa’s MLS® Market a Sign of Shared Confidence

The number of homes sold through the MLS® System of the Ottawa Real Estate Board (OREB) totaled 1,456 units in April 2024. This was an increase of 8.9% from April 2023.

Home sales were 2% below the five-year average and 6.9% below the 10-year average for the month of April.

On a year-to-date basis, home sales totaled 4,132 units over the first four months of the year — an increase of 11.5% from the same period in 2023.

“It’s a typical spring in Ottawa’s real estate market,” says OREB President Curtis Fillier. “What sets it apart from recent springs is a restored mutual confidence among both buyers and sellers. Buoyed by recent sales activity, sellers are more confident that they can move their property as evidenced by the uptick in listings. For buyers, the pressure of the pandemic market has eased and they’re comfortable taking the time to find the property that best suits their needs. The pace is still conservative while the economy is holding some back, but overall Ottawa’s market is strong and stable, and that’s a win-win.”

“The real story is in the details,” says Fillier. “Looking more closely at what’s selling and for how much suggests the demographic of buyer is changing. While most of Ottawa’s market is in balanced territory, townhomes have shifted to the seller’s market side as supply shrinks. Single-family homes are the most active market, which is inflating the average sale price. The next few months will be both telling and interesting as people continue to redefine their post-pandemic normal amid an upcoming federal election and back-to-work mandate for government workers. The detailed insights and data that REALTORS® have unique access to will be invaluable in helping buyers fine-tune their strategy for their specific neighbourhood and property type.”

By the Numbers – Prices:
The MLS® Home Price Index (HPI) tracks price trends far more accurately than is possible using average or median price measures.

  • The overall MLS® HPI composite benchmark price was $643,700 in April 2024, a marginal gain of 1.6% from April 2023.

    • The benchmark price for single-family homes was $727,700, up 1.6% on a year-over-year basis in April.

    • By comparison, the benchmark price for a townhouse/row unit was $500,800, up slightly at 1% compared to a year earlier.

    • The benchmark apartment price was $423,100, up 2.1% from year-ago levels.

  • The average price of homes sold in April 2024 was $705,117 increasing 1.2% from April 2023. The more comprehensive year-to-date average price was $675,817, increasing by 2.4% from the first four months of 2023.

  • • The dollar volume of all home sales in April 2024 was $1.02 billion, up 10.2% from the same month in 2023.

OREB cautions that the average sale price can be useful in establishing trends over time but should not be used as an indicator that specific properties have increased or decreased in value. The calculation of the average sale price is based on the total dollar volume of all properties sold. Prices will vary from neighbourhood to neighbourhood.

By the Numbers – Inventory & New Listings

  • The number of new listings saw an increase of 40.5% from April 2023. There were 2,597 new residential listings in April 2024. New listings were 19.7% above the five-year average and 4.6% above the 10-year average for the month of April.

  • Active residential listings numbered 2,966 units on the market at the end of April 2024, a gain of 36.6% from April 2023. Active listings were 62.6% above the five-year average and 13.7% below the 10-year average for the month of April.

  • Months of inventory numbered 2 at the end of April 2024, up only slightly from 1.6 in April 2023. The number of months of inventory is the number of months it would take to sell current inventories at the current rate of sales activity.

(SOURCE: OREB)

Read

OTTAWA REAL ESTATE - MARCH STATS (2024)

Ottawa MLS® Market Shows Early Signs of a Buzzing Spring Market

The number of homes sold through the MLS® System of the Ottawa Real Estate Board totaled 1,165 units in March 2024. This was an increase of 10% from March 2023.

Home sales were 21.5% below the five-year average and 15% below the 10-year average for the month of March.

On a year-to-date basis, home sales totaled 2,678 units over the first three months of the year — an increase of 13.1% from the same period in 2023.

“Ottawa’s real estate market is overall healthy, providing fertile ground for an active spring and summer ahead,” says OREB President Curtis Fillier. “The increases in new and active listings indicate that sellers are feeling more confident, boosted by the rise in showing activity. Buyers, however, aren’t acting as quickly as they perhaps should be — likely because affordability and supply are still roadblocks.”

“Something is around the corner in this market, though,” says Fillier. “People have adjusted to post-pandemic life and that means revisiting their housing needs. Some are downsizing or moving in from the city’s outskirts. Others are looking at more suitable properties that better meet all their needs, which weren’t accessible to them in the peak pandemic market. That’s creating pressure from multiple angles on the mid-range property market, which we know is tight to begin with in Ottawa. Just because you’re in the real estate market, doesn’t mean you’re safe from the market. If you’re a buyer or seller looking to make a move, I wouldn’t wait too long.”

By the Numbers – Prices:

The MLS® Home Price Index (HPI) tracks price trends far more accurately than is possible using average or median price measures.

  • The overall MLS® HPI composite benchmark price was $636,700 in March 2024, a gain of 2.7% from March 2023.

    • The benchmark price for single-family homes was $719,000, up 2.6% on a year-over-year basis in March.

    • By comparison, the benchmark price for a townhouse/row unit was $489,800, up slightly at 0.9% compared to a year earlier.

    • The benchmark apartment price was $423,200, up 4.3% from year-ago levels.

  • The average price of homes sold in March 2024 was $682,078 increasing 5.1% from March 2023. The more comprehensive year-to-date average price was $659,828, increasing by 3.2% from the first three months of 2023.

  • The dollar volume of all home sales in March 2024 was $794.6 million, up 15.6% from the same month in 2023.

OREB cautions that the average sale price can be useful in establishing trends over time but should not be used as an indicator that specific properties have increased or decreased in value. The calculation of the average sale price is based on the total dollar volume of all properties sold. Prices will vary from neighbourhood to neighbourhood.

By the Numbers – Inventory & New Listings

  • The number of new listings saw an increase of 13.5% from March 2023. There were 2,074 new residential listings in March 2024. New listings were 2.3% below the five-year average and 11.1% below the 10-year average for the month of March.

  • Active residential listings numbered 2,543 units on the market at the end of March 2024, a gain of 18.3% from March 2023. Active listings were 58.6% above the five-year average and 17.7% below the 10-year average for the month of March. Active listings haven’t been this high in the month of March in more than five years.

  • Months of inventory numbered 2.2 at the end of March 2024, up only slight from 2 in March 2023 and below the long-run average of 2.6 months for this time of year. The number of months of inventory is the number of months it would take to sell current inventories at the current rate of sales activity.

(SOURCE: OREB)
Read

OTTAWA REAL ESTATE - FEBRUARY STATS (2024)

Ottawa’s MLS® Market Activity Shows Strong Start to the Year

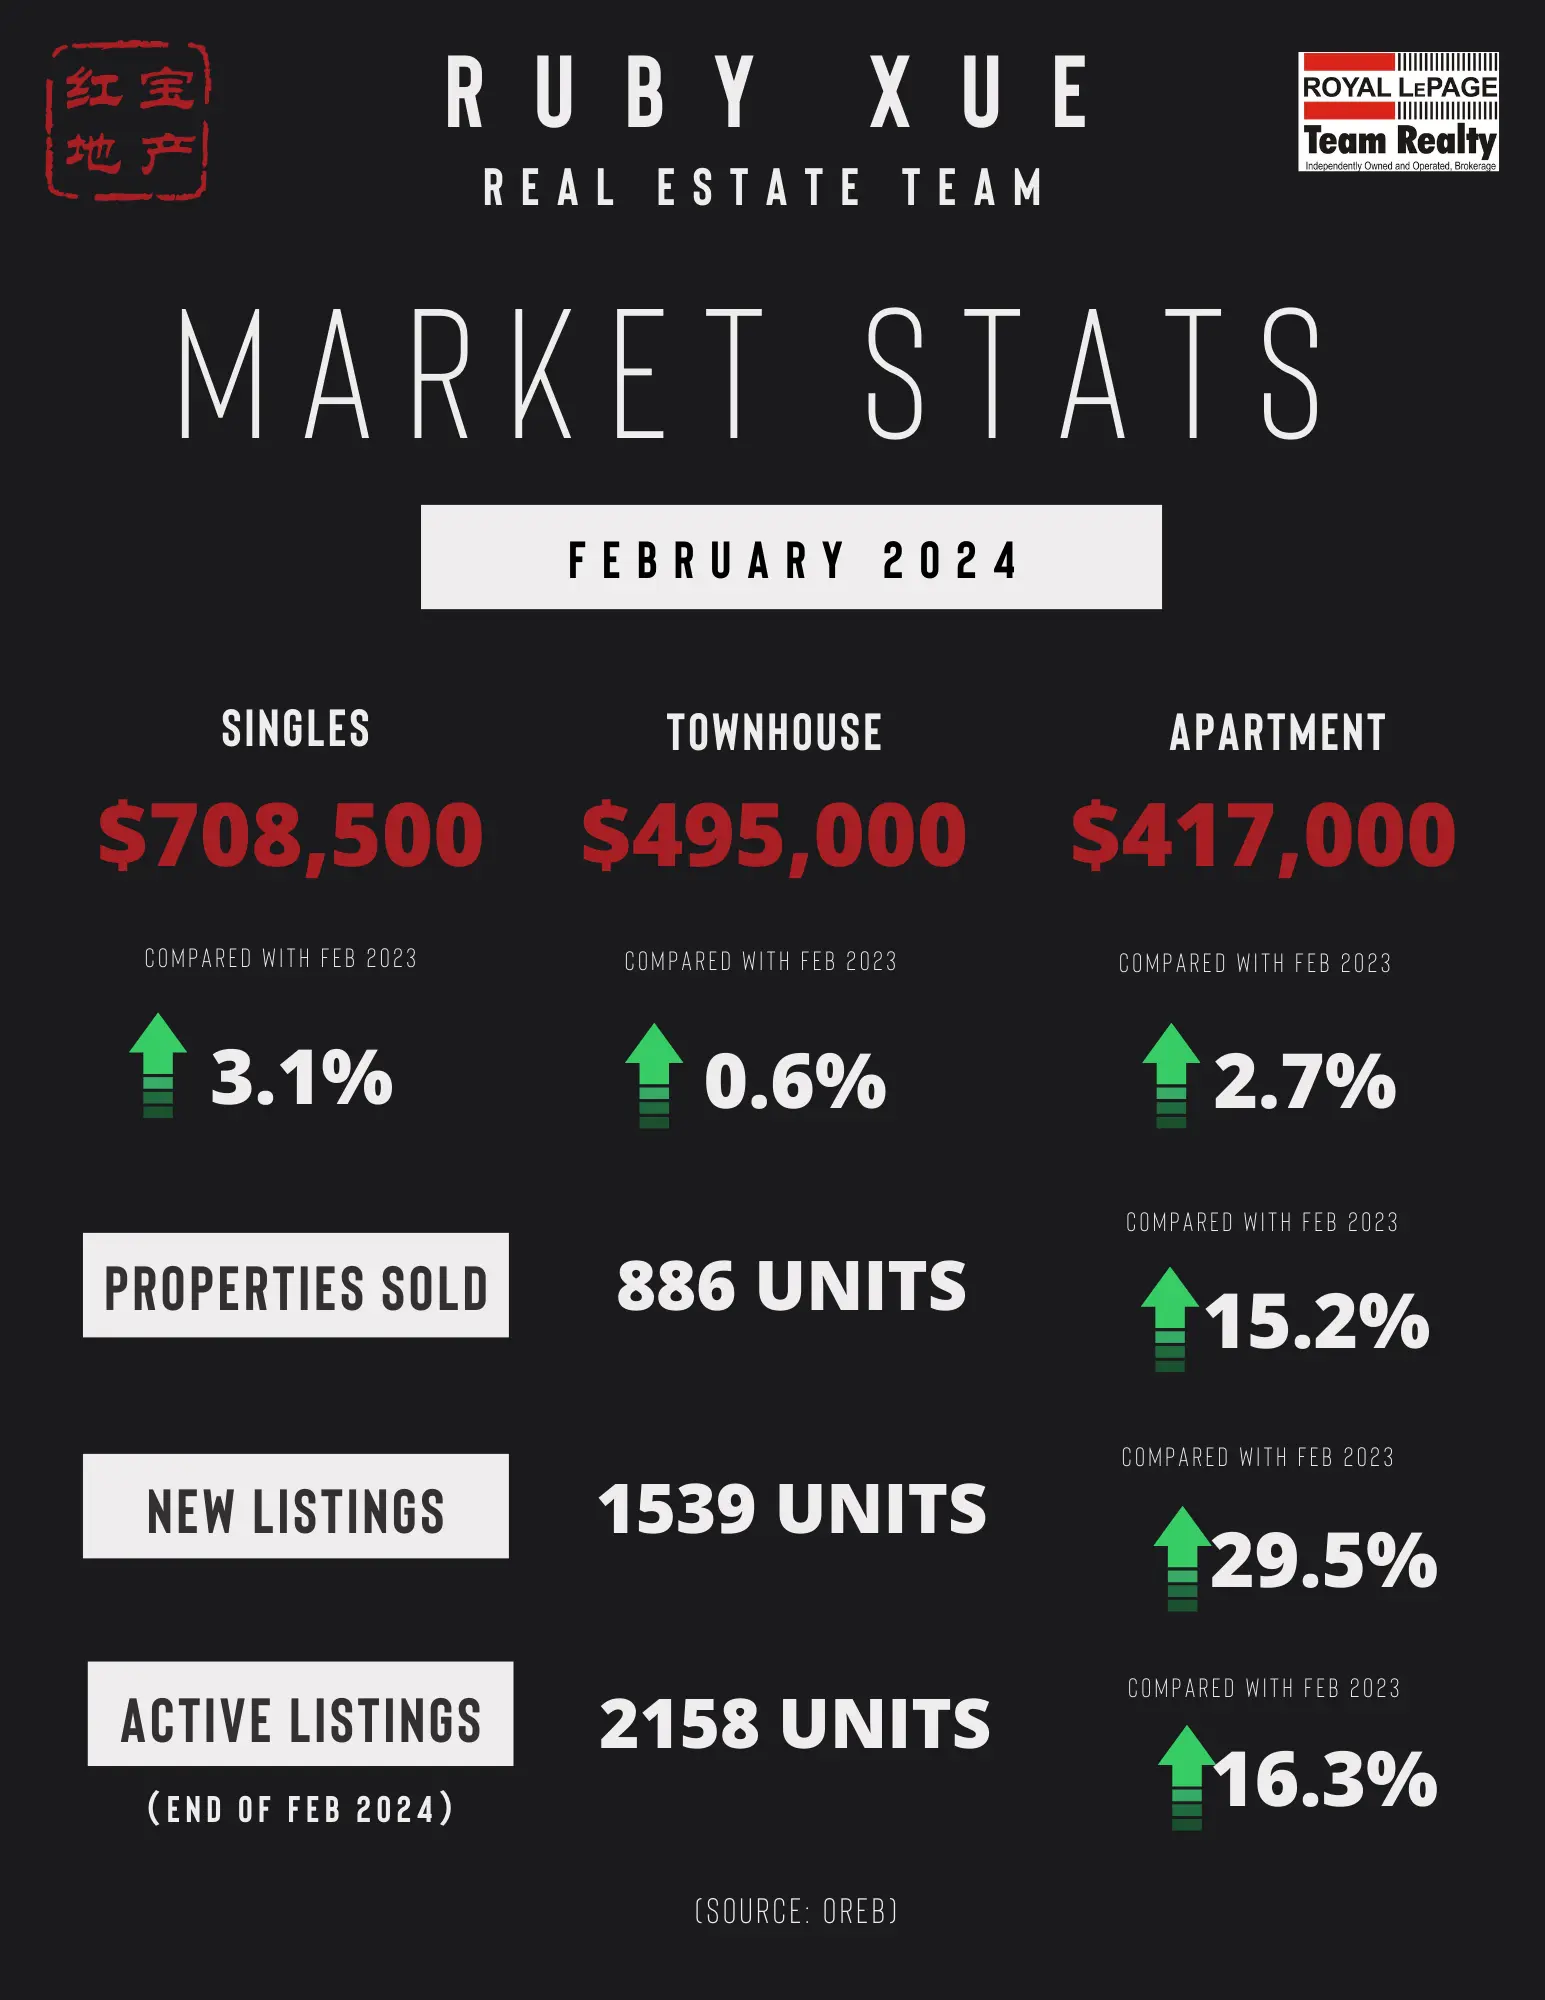
The number of homes sold through the MLS® System of the Ottawa Real Estate Board totaled 886 units in February 2024. This was an increase of 15.2% from February 2023.

Home sales were 13.8% below the five-year average and 5.7% below the 10-year average for the month of February.

“Even with higher prices and the interest rate holding steady, Ottawa is a strong, active market,” says OREB President Curtis Fillier. “With metrics across the board up from last year, it’s clear both buyers and sellers are making moves. The metrics, however, don’t tell us about all the people relegated to the sidelines because affordability remains out of reach for many.”

The Municipal Property Assessment Corporation (MPAC) recently reported that “communities with homes under $500,000 are becoming increasingly scarce.” A decade ago, 74% of Ontario residential properties had a home value estimate of less than $500,000 but that number has dropped to just 19% today.

“REALTORS® know firsthand there is persistent demand for housing in Ottawa, and our market’s activity is constrained by a lack of affordable and suitable supply,” says Fillier. “That’s why we’re currently advocating for impactful measures such as allowing four residential units on property lots and getting rid of exclusionary zoning. There’s a missing middle that we need to build up.”

By the Numbers – Prices:

The MLS® Home Price Index (HPI) tracks price trends far more accurately than is possible using average or median price measures.

  • The overall MLS® HPI composite benchmark price was $628,500 in February 2024, a gain of 2.8% from February 2023.

    • The benchmark price for single-family homes was $708,500, up 3.1% on a year-over-year basis in February.

    • By comparison, the benchmark price for a townhouse/row unit was $495,000, up slightly at 0.6% compared to a year earlier.

    • The benchmark apartment price was $417,000, up 2.7% from year-ago levels.

  • The average price of homes sold in February 2024 was $651,340, increasing 2% from February 2023.

  • The dollar volume of all home sales in February 2024 was $577 million, up 17.5% from the same month in 2023.

OREB cautions that the average sale price can be useful in establishing trends over time but should not be used as an indicator that specific properties have increased or decreased in value. The calculation of the average sale price is based on the total dollar volume of all properties sold. Prices will vary from neighbourhood to neighbourhood.

By the Numbers – Inventory & New Listings

  • The number of new listings saw an increase of 29.5% from February 2023. There were 1,539 new residential listings in February 2024. New listings were 10.3% above the five-year average and 3.3% below the 10-year average for the month of February.

  • Active residential listings numbered 2,158 units on the market at the end of February 2024, a gain of 16.3% from February 2023. Active listings were 59.6% above the five-year average and 17.7% below the 10-year average for the month of February.

  • Months of inventory numbered 2.4 at the end of February 2024, unchanged from February 2023. The number of months of inventory is the number of months it would take to sell current inventories at the current rate of sales activity.

(SOURCE: OREB)

Read

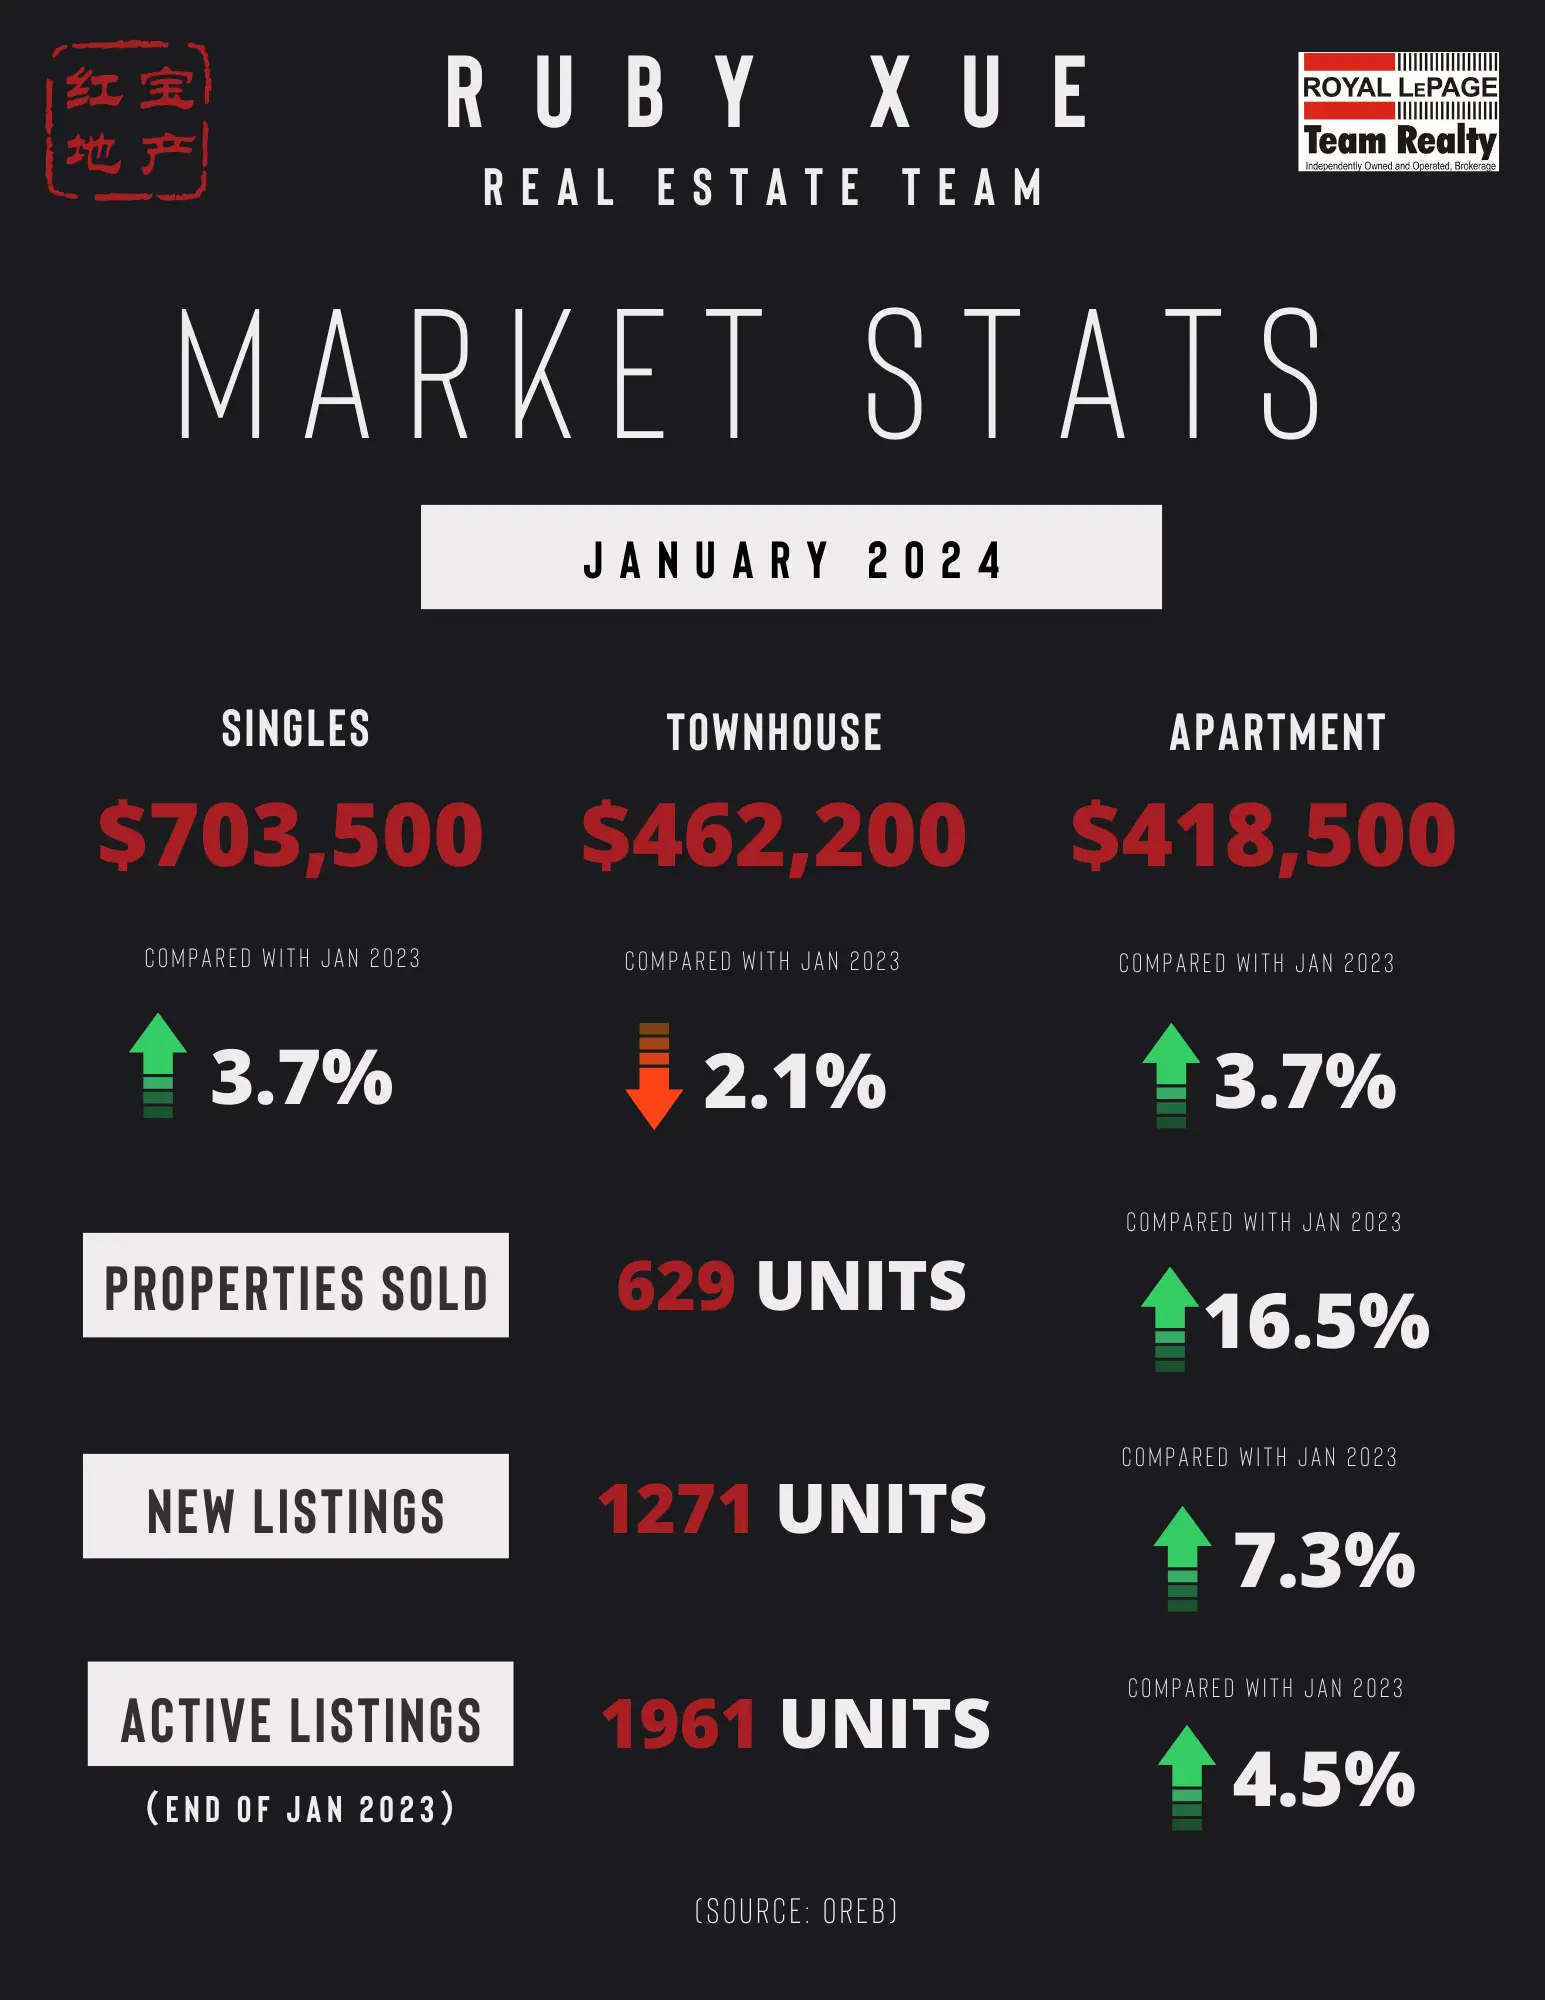
OTTAWA REAL ESTATE - JANUARY STATS (2024)

Ottawa’s MLS® Market Thawed in January but Sales Still Slow

The number of homes sold through the MLS® System of the Ottawa Real Estate Board totaled 629 units in January 2024. This was an increase of 16.5% from January 2023.

Home sales were 10.7% below the five-year average and 3.9% below the 10-year average for the month of January.

“Ottawa’s market activity is seeing positive gains over last year but it’s still a relatively quiet market even by pre-pandemic standards,” says OREB President Curtis Fillier. “While REALTORS® are telling us there’s lots of showing activity — probably thanks in part to the forgiving winter thus far — it’s not all translating to sales. This tells us that buyers are back out there looking, but still approaching cautiously. During the pandemic market, buyers had to move quickly and sometimes settle for a property that didn’t check all their boxes. Today, buyers are using the slower market to take the time needed to find their perfect place. Sellers would be well-advised to adjust their expectations and thoughtfully consider their pricing and timing strategy using the negotiating expertise and hyper-local data their REALTOR® can provide.”

“Ottawa’s market conditions can fluctuate quickly, though, because our supply is chronically low,” adds Brandon Reay, OREB’s policy and external relations manager. “Ottawa needs more suitable and affordable homes to address the housing crisis, and we need to increase density to meet population demands. We can’t restore and grow upon the market activity Ottawa saw five and ten years ago without more houses for people to buy. OREB recommends direct solutions for meaningful policy change, including streamlining the process at the Ontario Land Tribunal, eliminating exclusionary zoning, and permitting four units on residential lots. To meet the aggressive housing targets, we need to close the labour gap with investments in colleges and trade schools. We don’t need any more reactionary and distracting policy, like the federal government’s extension of the foreign buyers ban.”

By the Numbers – Prices:

The MLS® Home Price Index (HPI) tracks price trends far more accurately than is possible using average or median price measures.

  • The overall MLS® HPI composite benchmark price was $621,600 in January 2024, a gain of 3.2% from January 2023.

    • The benchmark price for single-family homes was $703,500, up 3.7% on a year-over-year basis in January.

    • By comparison, the benchmark price for a townhouse/row unit was $462,200, down 2.1% compared to a year earlier.

    • The benchmark apartment price was $418,500, up 3.7% from year-ago levels.

  • The average price of homes sold in January 2024 was $631,722, increasing 1.8% from January 2023.

  • The dollar volume of all home sales in January 2024 was $397.3 million, up 18.6% from the same month in 2023.

OREB cautions that the average sale price can be useful in establishing trends over time but should not be used as an indicator that specific properties have increased or decreased in value. The calculation of the average sale price is based on the total dollar volume of all properties sold. Price will vary from neighbourhood to neighbourhood.

By the Numbers – Inventory & New Listings

  • The number of new listings saw an increase of 7.3% from January 2023. There were 1,271 new residential listings in January 2024. New listings were 17.5% above the five-year average and 0.8% above the 10-year average for the month of January.

  • Active residential listings numbered 1,961 units on the market at the end of January 2024, a gain of 4.5% from the end of January 2023.

  • Active listings were 57.4% above the five-year average and 16.6% below the 10-year average for the month of January. Months of inventory numbered 3.1 at the end of January 2024, down from the 3.5 months recorded at the end of January 2023. The number of months of inventory is the number of months it would take to sell current inventories at the current rate of sales activity.

(SOURCE: OREB)

Read

渥太华房价【红宝地产】2024.6月房市数据报告
  1. 房地产交易量

    • 2024年6月,通过渥太华房地产委员会(OREB)的MLS®系统售出的房屋总数为1,439套,比2023年6月增加了0.1%。

    • 6月份的房屋销售量比五年平均水平低7.5%,比十年平均水平低13.2%。

    • 截至今年上半年,共售出7,109套房屋,比2023年同期增长了4.2%。

  2. 市场趋势

    • 渥太华房地产市场在夏季保持稳定活动。买家有更多时间选择合适的房产,市场上的房屋销售天数有所增加。

    • 卖家在市场上的活跃度增加,库存和挂牌量有所上升。渥太华的房地产市场正在逐渐恢复,并接近正常水平。

  3. 房价

    • 2024年6月,MLS®房价指数综合基准价格为647,700加元,比2023年6月下降了0.5%。

    • 独立屋的基准价格为734,300加元,同比下降0.2%。

    • 联排别墅的基准价格为501,500加元,同比下降1.6%。

    • 公寓的基准价格为420,800加元,同比下降1.7%。

    • 6月份房屋的平均售价为686,535加元,比2023年6月增加了0.5%。

  4. 库存和新挂牌量

    • 2024年6月,新增住宅挂牌量为2,469套,比2023年6月增加了4.7%。

    • 活跃住宅挂牌量为3,585套,比2023年6月增加了45.5%。

    • 库存月份为2.5个月,高于2023年6月的1.7个月。

渥太华房地产市场在经历之前的放缓后逐渐恢复,买家和卖家都在市场中找到更多机会。

(数据来源:渥太华地产局OREB)

Read

如何快速卖掉带租客的房子?几个实用技巧教你轻松变现!

大家好!欢迎来到本期视频,今天我们来聊聊一个许多房东都会遇到的问题:如何快速卖掉带租客的房子。其实卖掉带租客的房子其实并没有你想象中那么难。选择一位专业有经验的房产中介,可以帮你避免掉不少烦恼! 如果你正面临这个难题,希望这个视频能帮到你!

记得点赞👍和订阅🔔,还有更多实用的房产小贴士等着你哦!有任何问题欢迎在评论区留言,我会一一解答。谢谢观看,我们下期再见!😊

如果您在渥太华有任何房产方面的需要,欢迎联系红宝地产。

欢迎点击我们的网站www.rubyxue.ca,查阅更多渥太华房市讯息!

我们的联系方式:

办公室地址:6-224 HUNT CLUB RD, OTTAWA ON K1V 1C1

办公室电话:613-216-0057

网站:www.rubyxue.ca

Ruby Xue Real Estate Broker / Team Leader of Ruby Xue Real Estate Team Royal Lepage Team Realty, Brokerage 🌟【ROYAL LEPAGE CHAIRMAN‘S CLUB NATIONAL TOP 2%】 【TOP 100 TEAMS OF ROYAL LEPAGE TEAM REALTY 】 Office Address: 6-224 Hunt Club Rd, Ottawa ON K1V 1C1 Office Phone: 613-216-0057 Ottawa Home Selling | Ottawa Home Buying | Luxury Homes in Ottawa | Residential | Property Management | Condo | Commercial |Ottawa Realtor |Ottawa Real Estate | 渥太华买房卖房一条龙服务|渥太华华人地产经纪薛如冰RUBY XUE | 红宝地产 #房产 #卖房技巧 #带租客的房子 #房产投资 #快速卖房

Read

渥太华房价【红宝地产】2024.5月房市数据报告

渥太华五月MLS®房屋销售平稳谨慎

2024年5月,通过渥太华房地产委员会(OREB)MLS®系统销售的房屋总数为1,545套。这比2023年5月减少了9.2%。

5月的房屋销售量比五年平均水平低3.7%,比十年平均水平低13.2%。

从年初至今的基础上,2024年前五个月的房屋销售总数为5,673套,比2023年同期增加了5.2%。

“渥太华的早春市场并不令人意外地保持稳定,”OREB主席Curtis Fillier说。“新增房源的增加表明,卖家对市场活动的回升更有信心。然而,一些卖家可能在等待加拿大央行的利率公告,看看是否会影响他们的购买力。四年来的首次降息是个好消息,但在供应问题和高房价持续的情况下,预期仍需管理。”

“例如,降息并不能帮助建造更多的房屋并使其变得可负担,而渥太华市正在提高开发费用,这是一种适得其反的做法,OREB坚决反对。”

数据分析 – 价格:

MLS®房价指数(HPI)比使用平均或中位数价格指标更准确地跟踪价格趋势。

2024年5月,整体MLS®HPI综合基准价格为651,300加元,比2023年5月微增1.2%。 单户住宅的基准价格为736,000加元,同比上升1.1%。 相比之下,联排别墅/排屋的基准价格为517,500加元,同比上升2.1%。 公寓的基准价格为425,000加元,比去年同期上升2.0%。 2024年5月售出的房屋平均价格为690,683加元,比2023年5月上升0.8%。更全面的年初至今平均价格为679,862加元,比2023年前五个月上升1.8%。 2024年5月的房屋销售总金额为10.6亿加元,比2023年同期下降8.5%。

OREB警告说,平均销售价格可以用于建立长期趋势,但不应作为特定物业价值增加或减少的指标。平均销售价格的计算基于所有售出物业的总金额。价格因社区而异。

数据分析 – 库存与新上市

新上市数量比2023年5月增加了26.2%。2024年5月有3,034个新的住宅上市。新上市数量比五年平均水平高出23.2%,比十年平均水平高出10.2%。 2024年5月底的活跃住宅上市数量为3,552套,比2023年5月增加了59.4%。活跃上市数量比五年平均水平高出72.2%,比十年平均水平低2.9%。 2024年5月底的库存月数为2.3个月,高于2023年5月的1.3个月。库存月数是指按当前的销售活动率售出现有库存所需的月份数。

(数据来源:渥太华地产局OREB)

Read

渥太华房价【红宝地产】2024.4月房市数据报告

渥太华房市渐渐回暖,大家都更有信心

通过渥太华房地产局(OREB)的MLS®系统销售的房屋数量在2024年4月达到了1,456套,比2023年4月增加了8.9%。

4月份的房屋销售量比五年平均水平低2%,比十年平均水平低6.9%。

截至今年前四个月,房屋销售量达到了4,132套,比2023年同期增长了11.5%。

OREB主席Curtis Fillier表示:“渥太华的房地产市场在这个典型的春季表现出来。与近几年的春季相比,最大的不同之处在于买家和卖家之间恢复了相互信心。受到最近的销售活动的推动,卖家更有信心可以出售自己的房产,这可以从挂牌量的增加中看出。对于买家来说,疫情市场的压力已经减轻,他们愿意花时间找到最适合他们需求的房产。尽管经济仍然有所拖累,市场的步伐仍然保守,但总体而言,渥太华的市场依然强劲稳定,这是一个双赢。”

Fillier说:“真正的故事在细节中。仔细观察销售情况和价格可以发现买家的人口结构正在发生变化。尽管渥太华的大部分市场处于平衡状态,但联排别墅市场已经转向卖方市场,因为供应量在减少。独立屋市场最活跃,这推高了平均销售价格。接下来的几个月将会是充满告知和有趣的,因为人们在即将到来的联邦选举和政府工作人员返工的指令中继续重新定义他们的疫后新常态。房地产经纪人独有的详细见解和数据将对帮助买家优化他们在特定社区和房产类型上的策略至关重要。”

按数字 - 价格: MLS®住房价格指数(HPI)可以追踪价格趋势,比使用平均价格或中位价格措施更准确。

2024年4月,整体MLS® HPI基准价格为643,700加元,比2023年4月略有增长1.6%。 独立屋的基准价格为727,700加元,与去年4月相比略有增长1.6%。 相比之下,联排别墅/排屋的基准价格为500,800加元,与一年前相比略有增长1%。 公寓的基准价格为423,100加元,比去年同期增长2.1%。 2024年4月销售的房屋平均价格为705,117加元,比2023年4月增长1.2%。截至今年前四个月的平均价格为675,817加元,比2023年的前四个月增长了2.4%。 2024年4月所有房屋销售额为10.2亿加元,比2023年同月增长了10.2%。

OREB警告说,平均销售价格可以用来确定一段时间内的趋势,但不应作为特定属性价值增加或减少的指标。平均销售价格的计算基于所有销售房产的总金额。价格会因社区而异。

按数字 - 库存和新挂牌

新挂牌数量比2023年4月增加了40.5%。 2024年4月有2,597个新的住宅挂牌。 新挂牌比五年平均水平高19.7%,比十年平均水平高4.6%。 2024年4月底,市场上活跃的住宅挂牌数量为2,966套,比2023年4月增加了36.6%。 活跃挂牌比五年平均水平高62.6%,比十年平均水平低13.7%。 2024年4月底的库存月数为2个,与2023年4月的1.6个略有增加。 库存月数是指按照当前销售活动的速度出售当前库存所需的月数。

  (信息来源:渥太华地产局OREB)


Read

在加拿大如何成为一名地产经纪?成为安省地产经纪的要求和步骤都有哪些?你想知道的都在这里!


在加拿大如何成为一名地产经纪?成为安省地产经纪的要求和步骤都有哪些?你想知道的都在这里!

大家好我是渥太华【红宝地产】公司主理人薛如冰RUBY XUE。 今天来说一下,在安省如果你想成为地产经纪,都有什么要求和需要哪些步骤。

那下面我来说一下考安省地产经纪牌照的方法和步骤:

1.首先你要去Humber College的网站去注册,网站我放在下面了。一共5门课程,4门需要考试, 还有两个线上模拟。费用5门课加起来目前是$3590加币,加上后期RECO的注册费用,前期一共4000多加币。具体费用明细等请参照官网为准。

Humber College - Humber College

2. 在5门课都完成之后,需要签约一个经纪公司来去完成RECO的注册,需要提供一些你身份的证明和无犯罪证明等资料,一般申请递交之后1-2周内就会审核完成。然后你就会收到最后的地产经纪牌照。

3. 考取牌照的时间一般是6-12个月,要根据每个人学习的速度和能投入到学习的时间来定,每个人的情况不同。

那都有什么要求呢?考取经纪牌照的要求不算高,只要18岁以上,高中以上学历,在注册的时候有加拿大永居身份就可以了,工签也是可以注册的,但是经纪算是自雇类行业,如果你full time在经纪领域行业,这个工时并不能用来申请移民,学签可以注册humber的课程,但不能注册地产经纪牌照。

如果你在渥太华有需要加入地产公司,我们红宝地产会全程帮协助新经纪完成注册。还会提供很多细节和实战领域的培训,比如带客人看房的步骤,下offer都需要哪些内容等等。总之加入一个有经验的地产公司,会奠定一个比较坚实的基础,对经纪今后的职业生涯会很有帮助。

成为一名地产经纪虽然入门的门槛不高,但是后期要想做好,要求就很高了,经纪需要自身的不懈努力和坚定的意志。

如果你想成为一名地产经纪,千里之行始于足下,渥太华【红宝地产】期待你的加入。


Read
This website may only be used by consumers that have a bona fide interest in the purchase, sale, or lease of real estate of the type being offered via the website. The data relating to real estate on this website comes in part from the MLS® Reciprocity program of the PropTx MLS®. The data is deemed reliable but is not guaranteed to be accurate.