【红宝地产】渥太华房价|2023.12月房市数据|2024 RUBY对房产买卖的建议


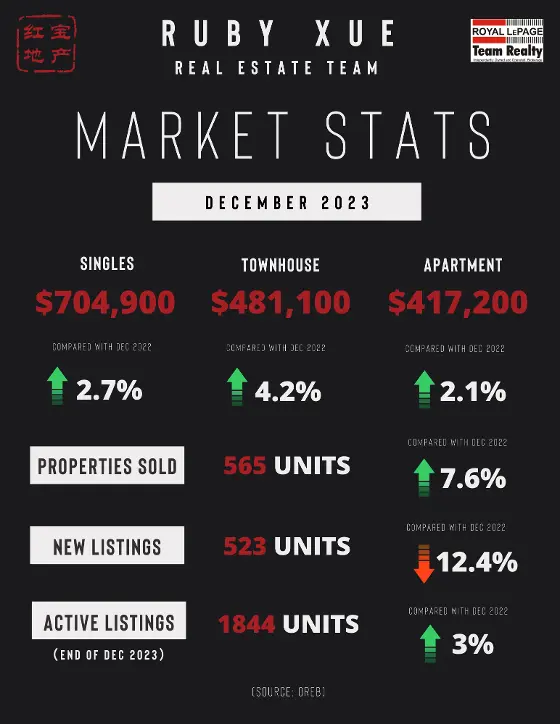
渥太华MLS® 2023年12月住宅销售稳健闭幕。
通过渥太华房地产委员会的MLS®系统销售的住宅数量在2023年12月达到了565套。这较2022年12月增长了7.6%。
12月份的住宅销售量比五年平均水平低16%,比十年平均水平低11.9%。
按年度计算,2023年全年的住宅销售总量为11,978套,较2022年下降了11.0%。
“渥太华的二手市场在年底保持了稳健的平衡状态,”渥太华房地产委员会主席柯蒂斯·菲利尔表示。“这可能是消费者信心回升的早期迹象。我们可能要到2024年下半年才能看到利率稳定的完全影响,但12月的活动为渥太华在未来一年的强劲表现奠定了基础。”
“这并不是最容易的市场,”渥太华房地产委员会的前主席肯·德克尔说。“虽然我们可能不会回到2022年的最高水平,但渥太华的市场已经准备好在过去一年的失去中恢复。现在买家和卖家都需要额外的耐心,但确实存在坚实的机会。”
数字统计 - 价格:
MLS®房屋价格指数(HPI)追踪价格趋势比使用平均或中位数价格测量更准确。
2023年12月的整体MLS® HPI综合基准价格为$623,900,比2022年12月上涨了2.7%。 单户住宅的基准价格为$704,900,较去年12月同比上涨了2.7%。 相比之下,联排别墅/排屋的基准价格为$481,100,较一年前上涨了4.2%。 基准公寓价格为$417,200,较去年同期上涨了2.1%。 2023年12月销售的住宅的平均价格为$632,487,比2022年12月增长了1.7%。全年平均价格为$667,794,较2022年下降了5.5%。 2023年12月所有住宅销售的总价值为3.573亿加币,比2022年同月增长了9.4%。 渥太华房地产委员会提醒,平均销售价格可以用于建立随时间变化的趋势,但不应作为特定物业价值是否增加或减少的指标。平均销售价格的计算基于所有售出物业的总金额。价格将因地区而异。
数字统计 - 库存和新上市:
新上市物业的数量从2022年12月减少了12.4%。2023年12月有523个新的住宅上市。新上市物业低于五年平均水平4%,低于12月的十年平均水平16.1%。 12月底市场上的活跃住宅上市数量为1,844套,较2022年12月底增长了3.0%。 活跃上市物业高于五年平均水平55.5%,低于12月的十年平均水平17.2%。 2023年12月底的库存月数为3.3个,低于2022年12月底记录的3.4个月。库存月数是以当前销售活动的速度销售当前库存所需的月数。
(来源:渥太华地产局)

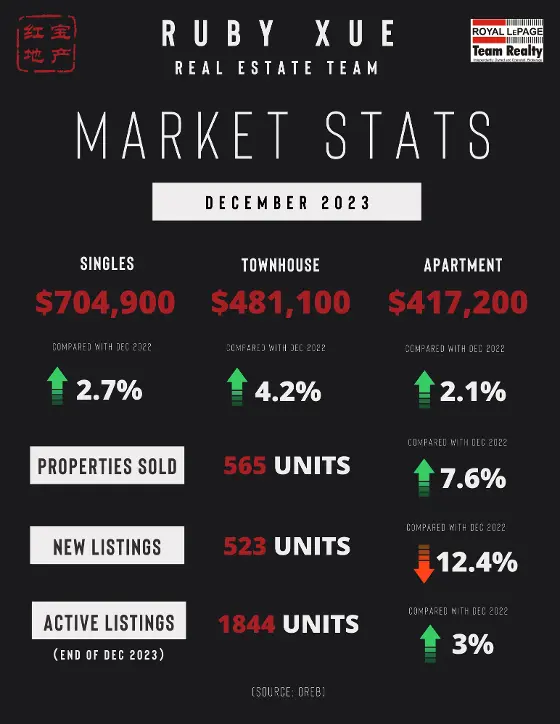
The number of homes sold through the MLS® System of the Ottawa Real Estate Board totaled 565 units in December 2023. This was an increase of 7.6% from December 2022.
Home sales were 16% below the five-year average and 11.9% below the 10-year average for the month of December.
On a year-to-date basis, home sales totaled 11,978 units in all of 2023 — a decline of 11.0% from 2022.
“Ottawa’s resale market closed out the year in a steady, balanced state,” says OREB President Curtis Fillier. “This could be an early indication that consumer confidence is returning. We likely won’t see the full impact of rate stabilization until the second half of 2024, but December’s activity bodes well for a strong year ahead in Ottawa.”
“It hasn’t been the easiest market,” says Ken Dekker, OREB’s Past-President. “And while we probably won’t return to the peak levels seen in 2022, Ottawa’s market is poised to recover any ground lost in the past year. Both buyers and sellers need extra patience right now, but solid opportunities are there.”
By the Numbers – Prices:
The MLS® Home Price Index (HPI) tracks price trends far more accurately than is possible using average or median price measures.
The overall MLS® HPI composite benchmark price was $623,900 in December 2023, a modest gain of 2.7% from December 2022.
The benchmark price for single-family homes was $704,900, up 2.7% on a year-over-year basis in December.
By comparison, the benchmark price for a townhouse/row unit was $481,100, up 4.2% compared to a year earlier.
o The benchmark apartment price was $417,200, up 2.1% from year-ago levels.
The average price of homes sold in December 2023 was $632,487, increasing 1.7% from December 2022. The more comprehensive year-to-date average price was $667,794, a decline of 5.5% from 2022.
The dollar value of all home sales in December 2023 was $357.3 million, up 9.4% from the same month in 2022.
OREB cautions that the average sale price can be useful in establishing trends over time but should not be used as an indicator that specific properties have increased or decreased in value. The calculation of the average sale price is based on the total dollar volume of all properties sold. Price will vary from neighbourhood to neighbourhood.
By the Numbers – Inventory & New Listings
The number of new listings saw a major decrease of 12.4% from December2022. There were 523 new residential listings in December 2023. New listings were 4% below the five-year average and 16.1% below the 10-year average for the month of December.
Active residential listings numbered 1,844 units on the market at the end of December, a gain of 3.0% from the end of December 2022.
Active listings were 55.5% above the five-year average and 17.2% below the 10-year average for the month of December.
Months of inventory numbered 3.3 at the end of December 2023, down from the 3.4 months recorded at the end of December 2022. The number of months of inventory is the number of months it would take to sell current inventories at the current rate of sales activity.
(SOURCE: OREB)

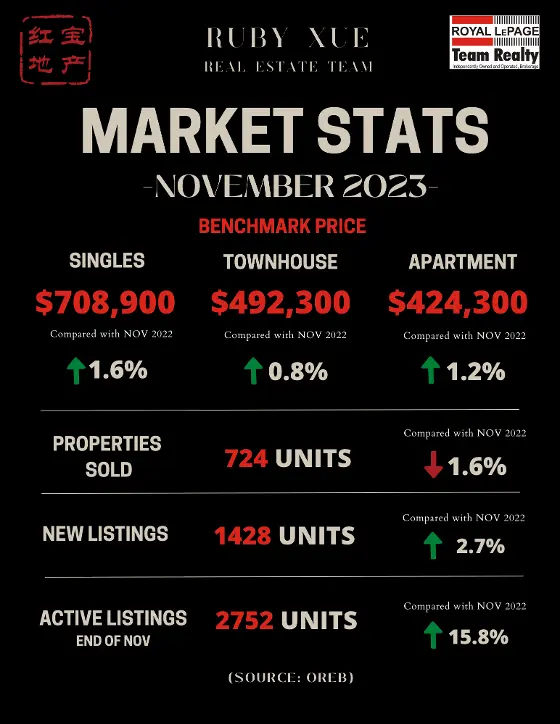
The number of homes sold through the MLS® System of the Ottawa Real Estate Board totaled 724 units in November 2023. This was a small reduction of 1.6% from November 2022.
Home sales were 31.8% below the five-year average and 27.4% below the 10-year average for the month of November.
On a year-to-date basis, home sales totaled 11,421 units after 11 months of the year. This was a decline of 11.7% from the same period in 2022.
“Sales are performing as expected with the arrival of colder months, and an uptick in new and active listings is bringing more choice back into the market,” says OREB President Ken Dekker. “While more choice may mean the pace of buying and selling has slowed, that doesn’t mean people looking to enter or upgrade in the market should sit back. Prospective buyers or those looking to upgrade have an opportunity to collaborate with their REALTOR® to carefully explore the market, identify the ideal property, and negotiate an attractive deal at their own pace. Sellers will have to manage their expectations regarding the quantity of offers and speed of transactions, and their REALTOR® is the best resource to help them confidently price and prepare their home for a quality sale.”
By the Numbers – Prices:
The MLS® Home Price Index (HPI) tracks price trends far more accurately than is possible using average or median price measures.
The overall MLS® HPI composite benchmark price was $628,900 in November 2023, nearly unchanged, up only 1.4% from November 2022.
The benchmark price for single-family homes was $708,900, up 1.6% on a year-over-year.
By comparison, the benchmark price for a townhouse was $492,300, nearly unchanged, up 0.8% compared to a year earlier.
The benchmark apartment price was $424,300, up 1.2% from year-ago levels.
The average price of homes sold in November 2023 was $633,138, decreasing 0.8% from November 2022. The more comprehensive year-to-date average price was $669,536, a decline of 5.7% from 11 months of 2022.
The dollar value of all home sales in November 2023 was $458.4 million, down 2.4% from the same month in 2022.
OREB cautions that the average sale price can be useful in establishing trends over time but should not be used as an indicator that specific properties have increased or decreased in value. The calculation of the average sale price is based on the total dollar volume of all properties sold. Price will vary from neighbourhood to neighbourhood.
By the Numbers – Inventory & New Listings
The number of new listings saw an increase of 2.7% from November 2022. There were 1,428 new residential listings in November 2023. New listings were 8.4% above the five-year average and 10.4% above the 10-year average for the month of November.
Active residential listings numbered 2,752 units on the market at the end of November, a sizable gain of 15.8% from the end of November 2022.
Active listings were 53.9% above the five-year average and 6.7% below the 10-year average for the month of November. Active listings haven’t been this high in the month of November in more than five years.
Months of inventory numbered 3.8 at the end of November 2023, up from the 3.2 months recorded at the end of November 2022 and above the long-run average of 3.3 months for this time of year. The number of months of inventory is the number of months it would take to sell current inventories at the current rate of sales activity.
(SOURCE: OREB)

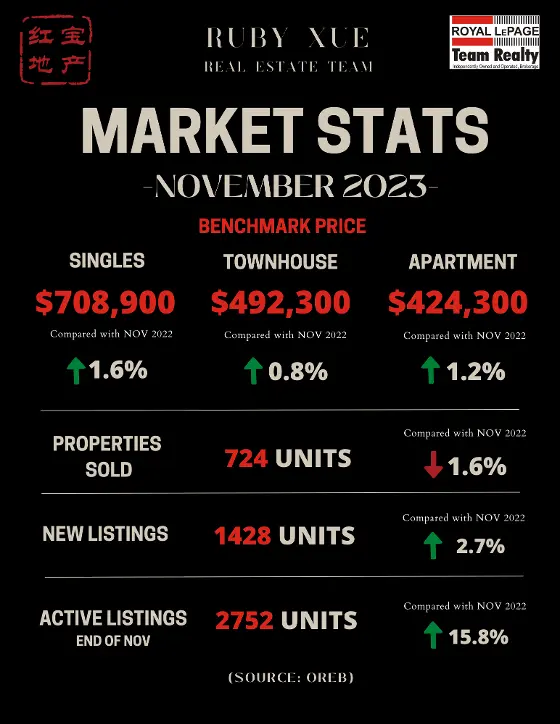
通过渥太华房地产局的系统销售的住宅总数在2023年11月达到了724套。这较2022年11月下降了1.6%。
房屋销售量比五年平均水平低31.8%,比11月份十年平均水平低27.4%。
截至目前,房屋销售在今年前11个月共计11,421套,较2022年同期下降了11.7%。
“随着寒冷月份的到来,销售表现如预期那样,并且新房源和活跃房源的增加为市场带来更多选择,” 渥太华房地产局主席肯·德克表示。“尽管更多的选择可能意味着购买和销售的速度减缓,但这并不意味着想要进入市场或升级的人应该坐等。潜在买家或寻求升级的人有机会与他们的房地产经纪人合作,仔细探索市场,找到理想的物业,并以自己的步调达成有吸引力的交易。卖家需要管理他们对报价数量和交易速度的期望,他们的房地产经纪人是帮助他们自信定价和准备房屋进行高质量销售的最佳资源。”
按数字统计 – 价格:
MLS®房屋价格指数(HPI)比平均或中位数价格措施更准确地跟踪价格趋势。
2023年11月,总体MLS® HPI基准价格为$628,900,几乎没有变化,仅比2022年11月上涨了1.4%。 单户住宅的基准价格为$708,900,同比增长1.6%。 相比之下,联排别墅的基准价格为$492,300,几乎没有变化,比一年前上涨了0.8%。 基准公寓价格为$424,300,比去年同期上涨了1.2%。 2023年11月销售的房屋平均价格为$633,138,较2022年11月下降了0.8%。全年平均价格为$669,536,比2022年11个月下降了5.7%。 2023年11月所有房屋销售的总价值为4.584亿,比2022年同月下降了2.4%。 渥太华房地产局提醒,平均销售价格可以用于建立随时间变化的趋势,但不应作为特定房产价值增加或减少的指标。平均销售价格的计算基于所有售出房产的总金额。价格会因社区而异。
按数字统计 – 库存和新上市:
新上市物业数量比2022年11月增加了2.7%。2023年11月新的住宅上市物业有1,428套。新上市物业比五年平均水平高8.4%,比11月份十年平均水平高10.4%。 截至2023年11月底,市场上有2,752套住宅物业待售,较2022年11月底增长了15.8%。 活跃房源比五年平均水平高53.9%,比11月份十年平均水平低6.7%。活跃房源在11月份已经五年多来没有这么高。 截至2023年11月底,库存月数为3.8个,高于2022年11月底记录的3.2个,也高于这个时候的长期平均水平3.3个月。库存月数是指以当前销售活动的速度销售当前库存所需的月数。
(来源:渥太华地产局)


渥太华十月份房屋销售呈现典型的冷淡态势
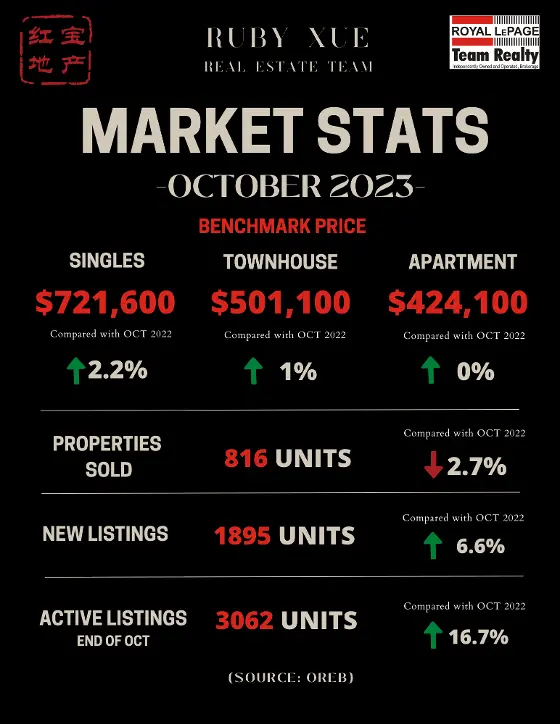
2023年10月,通过渥太华房地产局系统售出的房屋数量为816套。与2022年10月相比,略微减少了2.7%。
10月份的房屋销量比5年平均水平低36.4%,比10年平均水平低30.8%。
今年前 10 个月的房屋销售量为 10,700 套,同比大幅下降 12.4%。与 2022 年同期相比,大幅下降了 12.3%。
"OREB总裁肯-德克尔(Ken Dekker)说:"如今生活成本高昂,这很可能导致买家和卖家都按兵不动。"我们看到销售活动正在缓慢下降,但降幅很小,在每年的这个时候并不出人意料。价格正在调整和下降,这也表明了正在销售的房屋类型--公寓的销售活动比去年 10 月增长最多。虽然渥太华的库存量在缓慢增加,但长期的供应问题意味着需求始终存在。不要被眼前的冷清所迷惑:现在是买家寻找机会的最佳时机,以免被大流从平衡市场带入卖家领地。
价格:MLS® 房价指数 (HPI) 比平均价格或中位价格更准确地追踪价格趋势。
2023 年 10 月,MLS® HPI 综合基准价格为 63.86 万加币,几乎没有变化,与 2022 年 10 月相比仅上涨了 1.8%。
独户住宅的基准价格为72.16万加币,9月份同比上涨2.2%。
相比之下,联排别墅的基准价格为 50.11 万加币,几乎没有变化,与去年同期相比上涨了 1%。
公寓的基准价格为 42.41 万加币,与去年同期水平持平。
2023 年 10 月售出的住宅均价为 660,836 加币,比 2022 年 10 月上涨了 2.9%。今年迄今为止的综合平均价格为 671,983 加币,与 2022 年前十个月相比下降了 5.9%。
2023 年 10 月的所有房屋销售金额为 5.392 亿加币,与 2022 年同期持平。
OREB 提醒说,平均销售价格有助于确定一段时间内的趋势,但不应被用作特定房产升值或贬值的指标。平均售价是根据所有售出房产的总金额计算得出的。不同社区的价格会有所不同。
库存和新挂牌房源:
新挂牌房源数量比 2022 年 10 月增加了 6.6%。2023 年 10 月共有 1,895套新住宅挂牌。10月份的新挂牌量比五年平均水平高出 2%,比十年平均水平高出 5.4%。
截至 10 月底,市场上的活跃住宅挂牌量为 3,062套,与 2022 年 10 月底相比大幅增长了 16.7%。五年多来,10 月份的活跃挂牌量从未如此之高。
10月份的活跃房源比 5 年平均水平高出 43.8%,比10年平均水平低 10.9%。
2023年10月底的库存月数为3.8个月,略高于2022年10月底的3.1个月。库存月数是指以目前的销售活动速度出售当前库存所需的月数。
(来源:渥太华地产局)

The number of homes sold through the MLS® System of the Ottawa Real Estate Board totaled 816 units in October 2023. This was a small reduction of 2.7% from October 2022.
Home sales were 36.4% below the five-year average and 30.8% below the 10-year average for the month of October.
On a year-to-date basis, home sales totaled 10,700 units over the first 10 months of the year. This was a substantial decline of 12.3% from the same period in 2022.
“Life is expensive these days, which likely has both buyers and sellers staying put,” says Ken Dekker, OREB President. “We’re seeing a slow decline in sales activity but it’s minimal and not unexpected for this time of year. Prices are adjusting and coming down, which is also indicative of the types of homes that are selling — apartments seeing the largest increase in sales activity over last October. While Ottawa’s inventory is slowly building, chronic supply issues mean there’s always an undercurrent of demand. Don’t let the lull fool you: now is a prime time for buyers to be looking for opportunities before the current carries us from a balanced market into seller’s territory.”
By the Numbers – Prices:
The MLS® Home Price Index (HPI) tracks price trends far more accurately than is possible using average or median price measures.
The overall MLS® HPI composite benchmark price was $638,600 in October 2023, nearly unchanged, up only 1.8% from October 2022.
The benchmark price for single-family homes was $721,600, up 2.2% on a year-over-year basis in September.
By comparison, the benchmark price for a townhouse was $501,100, nearly unchanged, up 1% compared to a year earlier.
The benchmark apartment price was $424,100, unchanged from year-ago levels.
The average price of homes sold in October 2023 was $660,836, increasing 2.9% from October 2022. The more comprehensive year-to-date average price was $671,983, a decline of 5.9% from the first ten months of 2022.
The dollar value of all home sales in October 2023 was $539.2 million, unchanged from the same month in 2022.
OREB cautions that the average sale price can be useful in establishing trends over time but should not be used as an indicator that specific properties have increased or decreased in value. The calculation of the average sale price is based on the total dollar volume of all properties sold. Price will vary from neighbourhood to neighbourhood.
By the Numbers – Inventory & New Listings:
The number of new listings saw an increase of 6.6% from October 2022. There were 1,895 new residential listings in October 2023. New listings were 2% above the five-year average and 5.4% above the 10-year average for the month of October.
Active residential listings numbered 3,062 units on the market at the end of October, a sizable gain of 16.7% from the end of October 2022. Active listings haven’t been this high in the month of October in more than five years.
Active listings were 43.8% above the five-year average and 10.9% below the 10-year average for the month of October.
Months of inventory numbered 3.8 at the end of October 2023, just up from the 3.1 months recorded at the end of October 2022. The number of months of inventory is the number of months it would take to sell current inventories at the current rate of sales activity.
(SOURCE: OREB)


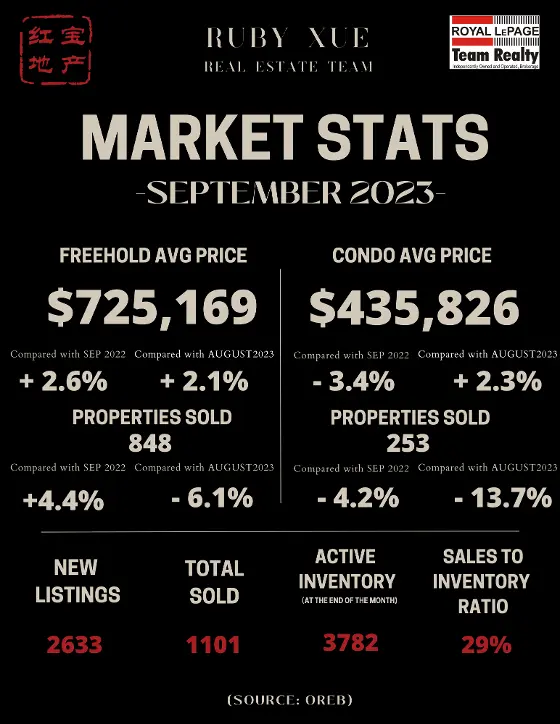
The number of homes sold through the MLS® System of the Ottawa Real Estate Board (OREB) totaled 946 units in September 2023. This was unchanged from September 2022.
Home sales were 29.6% below the five-year average and 23.6% below the 10-year average for the month of September.
On a year-to-date basis, home sales totaled 9,889 units over the first nine months of the year. This was a large decline of 13% from the same period in 2022.
“Sales activity came in right on par with where it stood at the same time last year but was still running well below typical levels for a September,” said Ken Dekker, OREB President. “New listings have surged in the past several months, which has caused overall inventories to begin gradually rising again. However, available supply is still low by historical standards, and we have ample room to absorb more listings coming on the market. Our market is also right in the middle of balanced territory, and while MLS® Benchmark prices are down from last year they are still trending at about the same levels from 2021.”
By the Numbers – Prices:
The MLS® Home Price Index (HPI) tracks price trends far more accurately than is possible using average or median price measures.
The overall MLS® HPI composite benchmark price was $643,600 in September 2023, nearly unchanged, up only 0.5% compared to September 2022.
The benchmark price for single-family homes was $727,500, essentially unchanged, up just 0.6% on a year-over-year basis in September.
By comparison, the benchmark price for townhouse/row units was $510,900, a small gain of 2.5% compared to a year earlier, while the benchmark apartment price was $422,300, falling by 1.1% from year-ago levels.
The average price of homes sold in September 2023 was $675,412, increasing by 2.7% from September 2022. The more comprehensive year-to-date average price was $672,837, a decline of 6.5% from the first nine months of 2022.
The dollar value of all home sales in September 2023 was $638.9 million, up modestly by 2.7% from the same month in 2022.
OREB cautions that the average sale price can be useful in establishing trends over time but should not be used as an indicator that specific properties have increased or decreased in value. The calculation of the average sale price is based on the total dollar volume of all properties sold. Price will vary from neighbourhood to neighbourhood.
By the Numbers – Inventory & New Listings
The number of new listings saw an increase of 9.8% from September 2022. There were 2,259 new residential listings in September 2023. New listings were 4.8% above the five-year average and 7% above the 10-year average for the month of September.
Active residential listings numbered 2,997 units on the market at the end of September, a sizable gain of 14% from the end of September 2022. Active listings haven’t been this high in the month of September in five years.
Active listings were 33.9% above the five-year average and 18.5% below the 10-year average for the month of September.
Months of inventory numbered 3.2 at the end of September 2023, up from the 2.8 months recorded at the end of September 2022 and below the long-run average of 3.3 months for this time of year. The number of months of inventory is the number of months it would take to sell current inventories at the current rate of sales activity.
(SOURCE: OREB)

(来源:渥太华地产局)