RSS

Ottawa Real Estate - April Stats (2023)

Resale Market Springs Back in Favour of Sellers

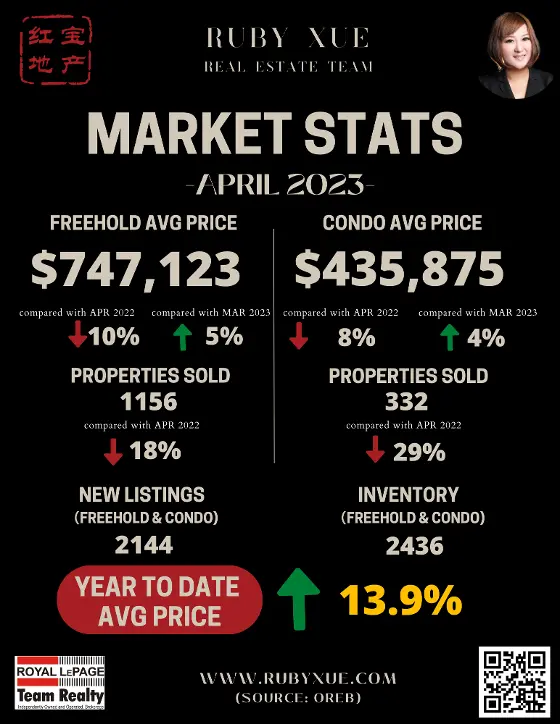
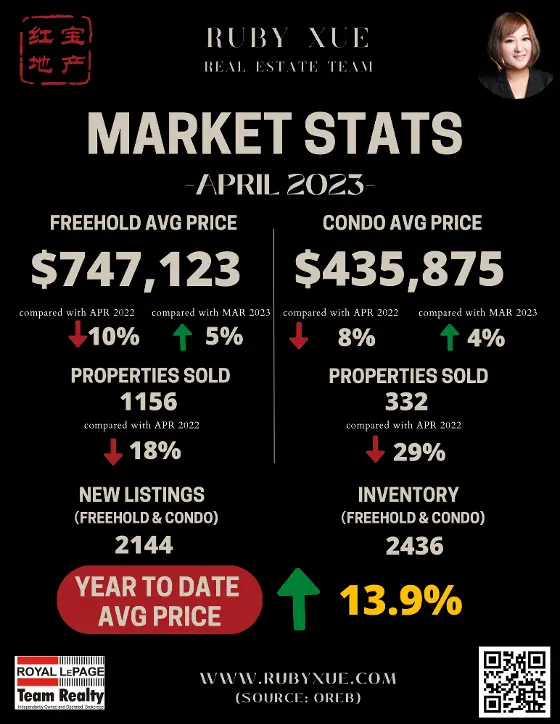
Members of the Ottawa Real Estate Board (OREB) sold 1,488 residential properties in April through the Board’s Multiple Listing Service® (MLS®) System, compared with 1,876 in April 2022, a decrease of 21%. April’s sales included 1,156 in the freehold-property class, down 18% from a year ago, and 332 in the condominium-property category, a decrease of 29% from April 2022. The five-year average for total unit sales in April is 1,739.

“Ottawa’s resale market is on a steady upward trajectory, narrowing the comparison gap to peak pandemic activity in 2022. However, with new listings not keeping pace, the available housing stock is declining, and with less than two months of inventory — we’re back into seller’s market territory,” says Ottawa Real Estate Board President Ken Dekker.

By the Numbers – Average Prices*:

  • Average prices have increased by 13.9% in four months since the market low in December 2022.

  • The average sale price for a freehold-class property in April was $747,123, a decrease of 10% from 2022. However, it marks a 5% increase over March 2023.

  • The average sale price for a condominium-class property was $435,875, decreasing 8% from a year ago, but still a 4% gain over March 2023.

  • With year-to-date average sale prices at $718,633 for freeholds and $421,722 for condos, these values represent a 13% decrease over 2022 for freehold-class properties and a 10% decrease for condominium-class properties.


“Upward pressure on sales prices continues with average prices increasing for the fourth month since the market low in December. Additionally, multiple offer situations have returned to certain neighbourhoods and overall days on market are maintaining their downward trend. There continues to be low inventory in certain property classes and new product is coming to the market at a slower rate, which is affecting supply.”

By the Numbers – Inventory & New Listings:

  • April’s new listings (2,144) were 25% lower than April 2022 (2,843) and up 3% from March 2023 (2,089). The 5-year average for new listings in April is 2,575.

  • Months of Inventory for the freehold-class properties has increased to 1.9 months from 0.9 months in April 2022 but down from 2.3 months in March.

  • Months of Inventory for condominium-class properties has increased to 1.9 months from 0.8 months in April 2022, although down from 2.1 months in March.

  • Days on market (DOM) for freeholds decreased from 34 to 27 days and 39 to 33 days for condos compared to last month.


“These numbers are static, snapshots in time. REALTORS® can give buyers and sellers a fulsome day-to-day picture of how the market is shifting and heating up this season. They have their fingers on the pulse of each neighbourhood in the city and can help buyers and sellers make localized, strategic, data-informed decisions.”

REALTORS® also help with finding rentals and vetting potential tenants. Since the beginning of the year, OREB Members have assisted clients with renting 2,151 properties compared to 1,786 last year at this time, an increase of 20%.

* OREB cautions that the average sale price can be useful in establishing trends over time but should not be used as an indicator that specific properties have increased or decreased in value. The calculation of the average sale price is based on the total dollar volume of all properties sold. Price will vary from neighbourhood to neighbourhood.

(SOURCE: OREB)

Read

渥太华房价【红宝地产】2023.3月房市数据报告

【红宝地产】2023年三月,渥太华房市数据新鲜出炉 各项指标和去年同期相比都是下降的,但和上个月比都是上升. 这应该是黎明前的黑暗了!

大家可能会被成交量下降近40%的数据迷惑. 其实去年的这个时候无论均价还是成交量是历史最高点,过了5月就一路下滑. 而今年开始一路上升,逐渐的就会产生交点,我预计在今年年中之后就会看到这个交点, 之后比例正向拉大.

上个月比较明显的现象是成交量激增,3月比2月的成交量上升了41%,这完全是价格产生变动的先兆. 目前正是处在价格上涨趋势萌芽中.

如果您打算买房或卖房,或者对渥太华的房市有任何疑问,可以找我聊聊.

(数据来源于渥太华地产局OREB。内容均由红宝地产团队整理归纳,仅供参考)

Read

Ottawa Real Estate - March Stats (2023)

March Resales: Signs of Spring Surge Sprouting

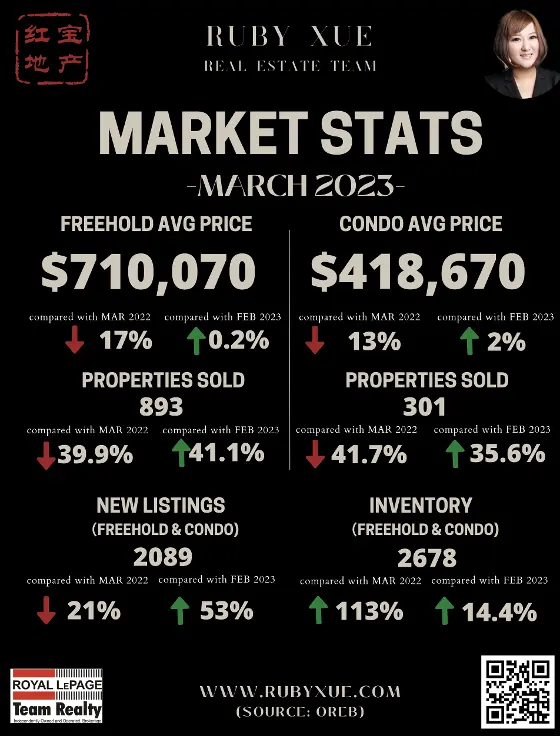
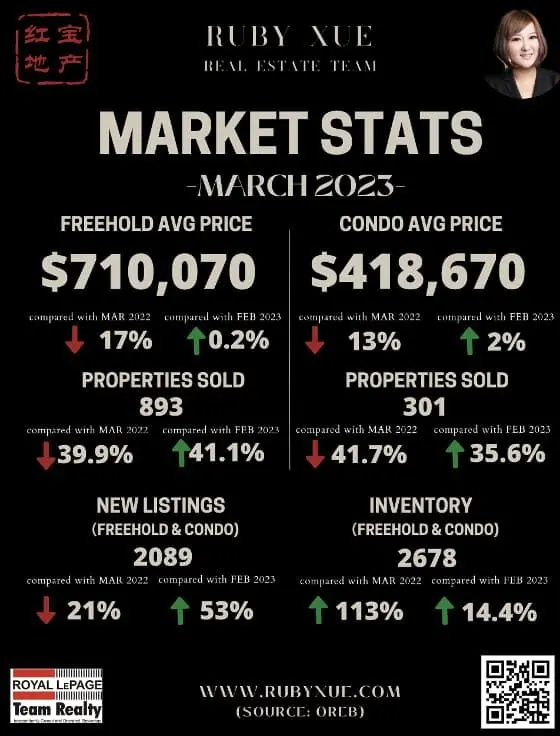
Members of the Ottawa Real Estate Board (OREB) sold 1,194 residential properties in March through the Board’s Multiple Listing Service® (MLS®) System, compared with 2,003 in March 2022, a decrease of 40%. March’s sales included 893 in the freehold-property class, down 40% from a year ago, and 301 in the condominium-property category, a decrease of 42% from March 2022. March sales transactions increased 40% over February. The five-year average for total unit sales in March is 1,698.

“The recent rise in transactions is a sign of typical spring activity, even if we’re behind the pandemic peaks of 2022. As spring unfolds, so too will a clearer picture of Ottawa’s balanced market state,” says Ottawa Real Estate Board President Ken Dekker.

By the Numbers – Average Prices*:

  • The average sale price for a freehold-class property in March was $710,070, a decrease of 17% from 2022. However, it marks a 0.2% increase over February 2023. Average freehold prices have climbed approximately 8% during Q1 2023 over December 2022’s market low.

  • The average sale price for a condominium-class property was $418,670, decreasing 13% from a year ago, but still a 2% gain over February 2023.

  • With year-to-date average sale prices at $701,837 for freeholds and $414,698 for condos, these values represent a 16% decrease over 2022 for freehold-class properties and an 11% decrease for condominium-class properties.


“As evidenced by the recent climb in freehold prices, Ottawa’s resale market is stabilizing along with the interest rate. Condos remain steady due to their lower price point, there’s more affordability based on the current interest rate structure. Prices are certainly headed in the right direction—if you are looking forward.”

By the Numbers – Inventory & New Listings:

  • Months of Inventory for the freehold-class properties has increased to 2.3 months from 0.6 months in March 2022.

  • Months of Inventory for condominium-class properties has increased to 2.8 months from 0.6 months in March 2022.

  • March’s new listings (2,089) were 21% lower than March 2022 (2,632) and up 53% from February 2023 (1,366). The 5-year average for new listings in March is 2,474.

  • Days on market (DOM) for freeholds decreased from 37 to 34 days and 43 to 39 days for condos compared to last month.


“Well-priced and well-prepared homes are selling. REALTORS® have up-to-the-minute statistics to ensure sellers are positioning themselves at the current market value based on recent sales and hyper-local market comparisons. Buyers can benefit from the same data along with their negotiation expertise to guarantee they are receiving the best value for their dollar.”

REALTORS® also help with finding rentals and vetting potential tenants. Since the beginning of the year, OREB Members have assisted clients with renting 1,599 properties compared to 1,291 last year at this time, an increase of 24%.

* OREB cautions that the average sale price can be useful in establishing trends over time but should not be used as an indicator that specific properties have increased or decreased in value. The calculation of the average sale price is based on the total dollar volume of all properties sold. Price will vary from neighbourhood to neighbourhood.

(SOURCE: OREB)
Read

Ottawa Real Estate - February Stats (2023)

Resale Market Stabilizes in February with a Glimmer of Hope for Buyers and Sellers Alike!

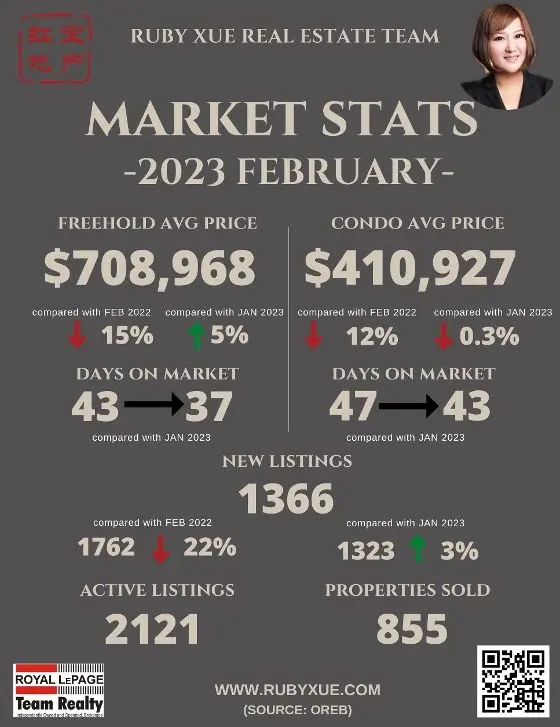
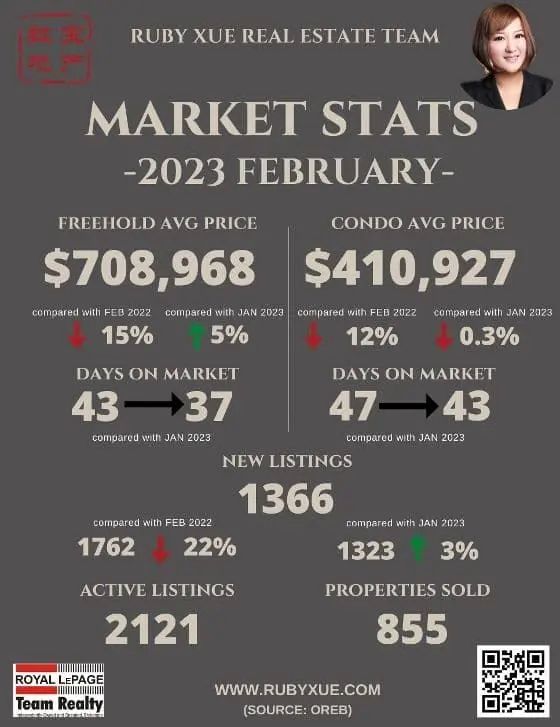
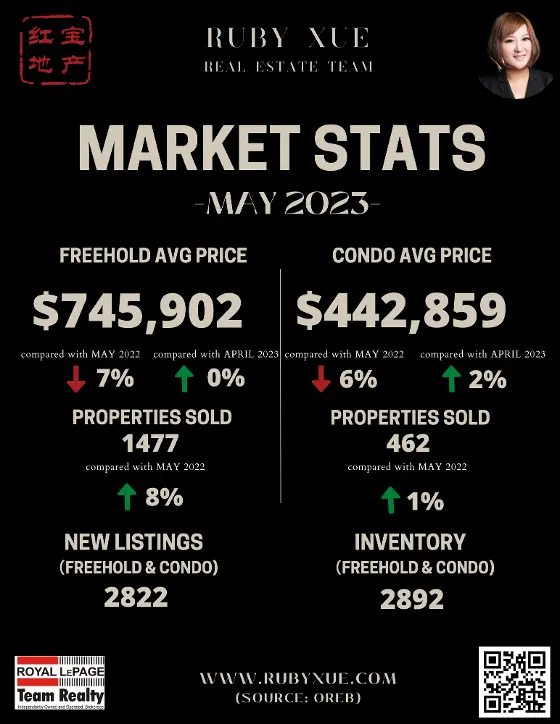
Members of the Ottawa Real Estate Board (OREB) sold 855 residential properties in February through the Board’s Multiple Listing Service® (MLS®) System, compared with 1,411 in February 2022, a decrease of 39%. February’s sales included 633 in the freehold-property class, down 42% from a year ago, and 222 in the condominium-property category, a decrease of 31% from February 2022. The five-year average for total unit sales in February is 1,157.

“We’re going to see declines in transactions and prices when we compare current figures to last February — the height of the pandemic resale market activity,” says Ottawa Real Estate Board’s President Ken Dekker. “On the other hand, with the Bank of Canada holding interest rates steady, prospective buyers have more budget certainty to work with as we head into the spring market.”

By the Numbers – Average Prices*:

  • The average sale price for a freehold-class property in February was $708,968, a decrease of 15% from 2022. However, it marks a 5% increase over January 2023.

  • The average sale price for a condominium-class property was $410,927, decreasing 12% from a year ago.

  • With year-to-date average sale prices at $695,086 for freeholds and $411,449 for condos, these values represent a 14% decrease over 2022 for freehold-class properties and a 10% decrease for condominium-class properties.


“The average price increase for freeholds over January could be an indicator that buyers have normalized to the current interest rates. And perhaps, it’s a glimmer of more activity to come in the months ahead.”

By the Numbers – Inventory & New Listings:

  • Months of Inventory for the freehold-class properties has increased to 2.8 months from 0.7 months in February 2022.

  • Months of Inventory for condominium-class properties has increased to 2.5 months from 0.7 months in February 2022.

  • February’s new listings (1,366) were 22% lower than February 2022 (1,762) and up 3% from January 2023 (1,323). The 5-year average for new listings in February is 1,632.

  • Days on market (DOM) for freeholds decreased from 43 to 37 days and 47 to 43 days for condos compared to last month.


“A decrease in the days on market, paired with fewer new listings entering the market, is good news for sellers,” says Dekker. “However, if that trend continues to impact our supply stock and we don’t get more inventory, our otherwise balanced market could swing back into seller’s territory — but it’s too early to predict.”

“The best advice for sellers and buyers in today’s market is to pay close attention to the comparison and competition insights only a REALTOR® can offer. Ottawa is made up of many micro-markets, and neighbourhood-level data is vital to standing out and closing deals.”

REALTORS® also help with finding rentals and vetting potential tenants. Since the beginning of the year, OREB Members have assisted clients with renting 995 properties compared to 800 last year at this time, an increase of 24%.

* OREB cautions that the average sale price can be useful in establishing trends over time but should not be used as an indicator that specific properties have increased or decreased in value. The calculation of the average sale price is based on the total dollar volume of all properties sold. Price will vary from neighbourhood to neighbourhood.

(SOURCE: OREB)

Read

渥太华房价【红宝地产】2023.1月房市数据报告

"1月份的单位销售量比2022年明显放缓,表明潜在的购房者正在慢慢来," OREB主席Ken Dekker说。"虽然上个月看到加拿大银行宣布的连续加息的高潮,负担能力仍然是一个因素。他们可能在等待上市价格的转变。在不确定的条件下,他们正在谨慎行事。"

1月份公寓级房产的平均售价为$412,244,比2022年下降了8%。
住宅类房产的平均售价为$676,272,比一年前下降了12%。

"尽管平均价格下降,但不应该认为市场在下滑,"Dekker说。"超强的卖方市场现在已经趋于平缓,达到我们目前的平衡市场状态。"

"从积极的方面看,与12月的数据相比,1月的住宅类房产的平均价格增加了3%。公寓的平均价格与12月相比确实下降了5%,但由于数据量小,公寓的价格往往波动较大。"

从数字上看--库存量和新上市的房源数量。

住宅类房产的库存月数已从2022年1月的0.9个月增加到3.8个月。
公寓类房产的库存月数从2022年1月的0.8个月增加到了3.8个月。

1月的新挂牌房源(1324套)比2022年同期(1142套)高16%,比2022年12月(699套)高89%。

1月份的新挂牌房源的5年平均数为1233套。

"渥太华的库存和上市天数是典型的平衡市场,也是买家不再竞相报价的一个迹象,"德克说。"新上市房源和供应量的增加对购房者来说是一个福音,他们现在有了更多的选择,能够以不那么疯狂的速度带着条件下offer。房地产经纪人是为合适的买家找到合适的房产的重要资源。在交易的另一方,房地产经纪人可以帮助卖家,在定价是关键的时候,更好地了解如何在他们的社区销售。

(通过www.DeepL.com/Translator翻译, 数据来源于渥太华地产局OREB。内容均由红宝地产团队整理归纳,仅供参考)

Read
This website may only be used by consumers that have a bona fide interest in the purchase, sale, or lease of real estate of the type being offered via the website. The data relating to real estate on this website comes in part from the MLS® Reciprocity program of the PropTx MLS®. The data is deemed reliable but is not guaranteed to be accurate.